1,818
Views
13
CrossRef citations to date
0
Altmetric
Original Articles

Gut bacteria producing phenols disturb keratinocyte differentiation in human skin

, &
Pages 221-227 | Received 07 May 2009, Accepted 15 Oct 2009, Published online: 26 Dec 2009

Figures & data

Table I. Nutritional data for the prebiotic beverage.

Figure 1. Correlation between levels of serum phenols and corneocyte size in healthy women. Serum (A) phenol and (B) p-cresol levels and corneocyte size (taken as the mean size of 30 measured cells/human) of inner forearm skin were measured in 50 healthy female volunteers (aged 21–60 years). Spearman's rank correlation between phenol levels and corneocyte size was analyzed. Each individual's value is plotted as a diamond. Spearman's rank-correlation coefficient (RS) and the two-tailed p value (p) are indicated.
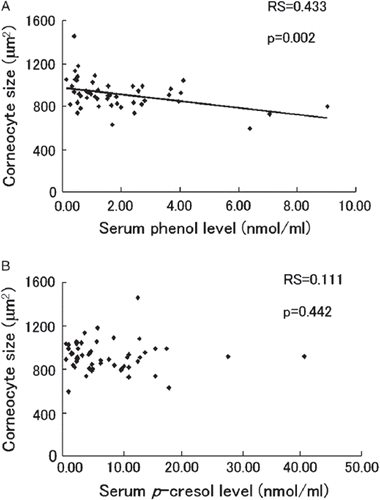
Figure 1. Correlation between levels of serum phenols and corneocyte size in healthy women. Serum (A) phenol and (B) p-cresol levels and corneocyte size (taken as the mean size of 30 measured cells/human) of inner forearm skin were measured in 50 healthy female volunteers (aged 21–60 years). Spearman's rank correlation between phenol levels and corneocyte size was analyzed. Each individual's value is plotted as a diamond. Spearman's rank-correlation coefficient (RS) and the two-tailed p value (p) are indicated.

Figure 2. Variation in levels of serum phenols in healthy women administered a prebiotic beverage. Nineteen healthy female volunteers (aged 21–39 years) were administered a prebiotic beverage containing 3.0 g galacto-oligosaccharides and 5.6 g polydextrose for 3 weeks. The serum (A) phenol and (B) p-cresol levels at week 0 (before) and week 3 (after) were measured and each individual variation is plotted as a fine line. Mean values are plotted as black circles connected by a thick line. The statistical significance of variation between before and after determined by the Wilcoxon's signed rank sum test is indicated as ***p < 0.001.
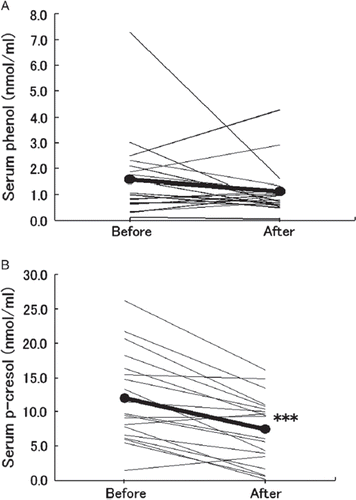
Figure 2. Variation in levels of serum phenols in healthy women administered a prebiotic beverage. Nineteen healthy female volunteers (aged 21–39 years) were administered a prebiotic beverage containing 3.0 g galacto-oligosaccharides and 5.6 g polydextrose for 3 weeks. The serum (A) phenol and (B) p-cresol levels at week 0 (before) and week 3 (after) were measured and each individual variation is plotted as a fine line. Mean values are plotted as black circles connected by a thick line. The statistical significance of variation between before and after determined by the Wilcoxon's signed rank sum test is indicated as ***p < 0.001.

Figure 3. Variation in skin condition of healthy women administered a prebiotic beverage. Nineteen healthy female volunteers (aged 21–39 years) were administered a prebiotic beverage containing 3.0 g galacto-oligosaccharides and 5.6 g polydextrose for 3 weeks. (A) The corneocyte size (taken as the mean size of 30 measured cells/human) of inner forearm skin was measured at week 0 (before) and week 3 (after). (B) At identical intervals, cathepsin L-like protease activity in stratum corneum of inner forearm skin was measured. Each individual variation is plotted as a fine line. Mean values are plotted as black circles connected by a thick line. The statistical significance of variation between before and after analyzed by the Wilcoxon's signed rank sum test is indicated as ***p < 0.001.
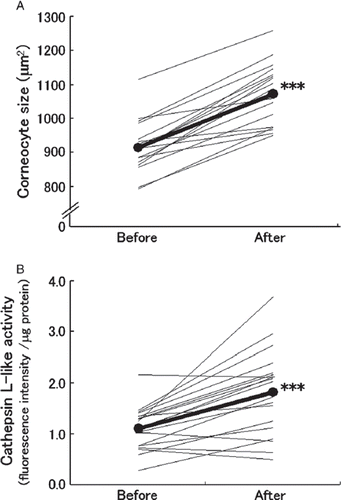
Figure 3. Variation in skin condition of healthy women administered a prebiotic beverage. Nineteen healthy female volunteers (aged 21–39 years) were administered a prebiotic beverage containing 3.0 g galacto-oligosaccharides and 5.6 g polydextrose for 3 weeks. (A) The corneocyte size (taken as the mean size of 30 measured cells/human) of inner forearm skin was measured at week 0 (before) and week 3 (after). (B) At identical intervals, cathepsin L-like protease activity in stratum corneum of inner forearm skin was measured. Each individual variation is plotted as a fine line. Mean values are plotted as black circles connected by a thick line. The statistical significance of variation between before and after analyzed by the Wilcoxon's signed rank sum test is indicated as ***p < 0.001.

Figure 4. Physiological effect of phenols on cultured keratinocytes. Monolayer-cultured normal human epidermal keratinocytes were subjected to 20 nmol/ml phenol (Phenol), 20 nmol/ml p-cresol (Cresol), or distilled water (Control) in equal volumes for 3 days. On day 3, (A) cell viability indicated by tetrazolium salt color reaction to metabolism, and (B) keratin 10 protein (K10) expression level indicated by western blot analysis were measured. Three independent experiments were carried out. Percent control for each was calculated and is plotted as mean and SD for the three. The statistical significance of differences observed among the three groups was determined by the Tukey test and is indicated as **p < 0.01.
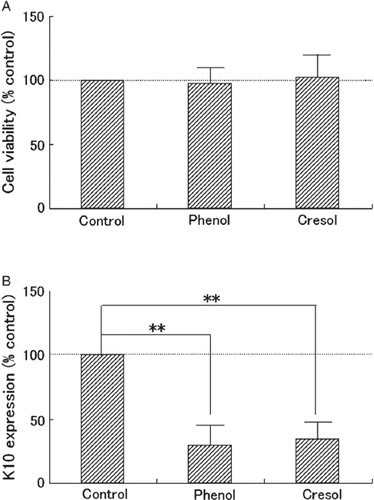
Figure 4. Physiological effect of phenols on cultured keratinocytes. Monolayer-cultured normal human epidermal keratinocytes were subjected to 20 nmol/ml phenol (Phenol), 20 nmol/ml p-cresol (Cresol), or distilled water (Control) in equal volumes for 3 days. On day 3, (A) cell viability indicated by tetrazolium salt color reaction to metabolism, and (B) keratin 10 protein (K10) expression level indicated by western blot analysis were measured. Three independent experiments were carried out. Percent control for each was calculated and is plotted as mean and SD for the three. The statistical significance of differences observed among the three groups was determined by the Tukey test and is indicated as **p < 0.01.