Figures & data
Table I. Important functions of the intestinal microbiota.
Table II. Gastrointestinal diseases associated with disturbances of the intestinal microbiota.
Figure 1. The increase in basic scientific and clinical publications on probiotics during the years 1990–2008, indicating the growing interest of the scientific and the medical community in this topic. The black bars (and the corresponding numbers on top of the bars) represent the total numbers of scientific and clinical publications in the respective year. The inserted open bars (and the corresponding numbers) represent the numbers of published clinical trials with probiotics. Source: National Library of Medicine Database MEDLINE; search and graphics performed by M. Schiemann, Herdecke, Germany.
Figure 2. Photographic portrait of Professor Alfred Nissle MD (1874–1965), discoverer of the antagonistic action of certain commensal E. coli strains against enteropathogens. In 1917, Alfred Nissle isolated the specific E. coli strain, now called E. coli Nissle 1917 (EcN), from the feces of a healthy young man (Citation48,Citation49). Photograph courtesy of Alfred-Nissle-Gesellschaft, Hagen, Germany.
Table III. Basic microbiological and molecular genetic characteristics of E. coli strain Nissle 1917 (EcN, serotype O6:K5:H1).
Table IV. Taxonomically important enzymes present in and biochemical reactions performed by E. coli strain Nissle 1917 (EcN); comparison with the corresponding characteristics typical of the enterobacterial species Escherichia coli in general.
Figure 3. Functional genomic map of E. coli Nissle 1917 (EcN) (Citation56,Citation80). Five large genetic islands (GEI I to GEI V) and some smaller genetic islets coding for different so-called ‘fitness factors’ are inserted at distinct sites (mainly next to tRNA-encoding sequences) into the chromosome of the EcN strain. The bars on the chromosome circle mark the positions of tRNA genes (in gray: tRNA genes with sequence contexts identical to those of the completely sequenced non-pathogenic E. coli K-12 strain MG1655; in black: tRNA genes with sequence contexts identical to the completely sequenced uropathogenic E. coli O6 strain CFT073). The following genes and gene clusters of the EcN strain have been identified and sequenced: fim encoding F1A fimbriae (‘common type-1 fimbriae’); csg encoding curli fimbriae; mch/mcm encoding microcin H47 and microcin M synthesis; foc encoding F1C fimbriae; iro/ybt/iuc encoding the siderophores salmochelin, yersiniabactin, and aerobactin; clb/pks (colibactin gene cluster) encoding non-ribosomal peptide synthetases, polyketide synthases and accessory proteins; sat encoding Sat protease; iha encoding Iha adhesion; sap encoding Sap-like autotransporter; kps encoding capsule synthesis; chu encoding hemin iron uptake system; bcs encoding cellulose biosynthesis; wa*/wb* encoding LPS biosynthesis.
Figure 4. Strain-specific multiplex PCR for identification of E. coli Nissle 1917 (EcN). PCR and agarose gel electrophoresis were performed as described (Citation53). The PCR yields three distinct DNA products of Mr 313, 361, and 427 bp length. Using this test system, the detection limit of EcN is between 102 and 103 bacterial cells/ml. Photograph: K. Eiteljörge, Herdecke.
Figure 5. Determination of antagonistic activity of E. coli Nissle 1917 (EcN) against another E. coli strain (DSM 423) in vitro. A suspension of E. coli DSM 423 was homogeneously spread across the surface of an agar plate (PAG minimal medium). Small cylinders of agar were punched out using a punching tool and the resulting cavities were filled with 10, 20 or 50 μl of an overnight culture of EcN (2 × 10⁹ cfu/ml). Tests were performed in duplicate. The picture was taken after 24 h of aerobic incubation at 37°C. Antagonistic activity becomes visible by the development of inhibition zones (halos) around the cavities containing the EcN suspension. Photograph: U. Sonnenborn, Herdecke.
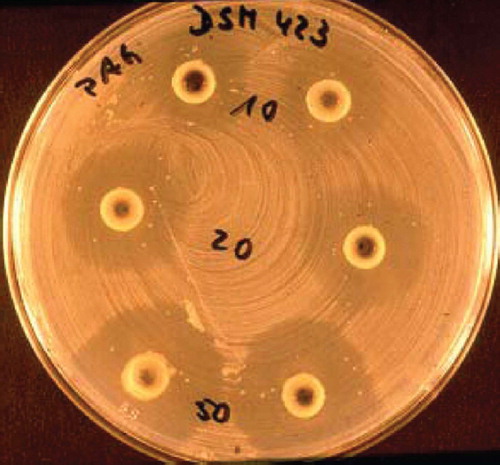
Figure 6. Antagonistic action of E. coli Nissle 1917 (EcN) against enteropathogenic E. coli 542/88 in vivo in gnotobiotic piglets (Citation94). Four 7-day-old germ-free piglets were infected orally with 108 cfu of E. coli 542/88 (arrow). The enteropathogenic E. coli strain quickly colonized the gut (dotted black line) and reached stable bacterial counts (about 1010 cfu/g contents). Shortly after infection the animals showed signs of diarrheal illness. At day 6 of the experiment, when the piglets were visibly ill, they received an EcN suspension p.o. (2 × 10⁸ cfu) (double arrow). Although the pathogenic E. coli strain had already settled in the gut, EcN also colonized the intestine fairly well (straight black curve). Six days later, the pathogen was completely expelled from the gut, whereas EcN continuously showed a high population level, and the piglets recovered.
Figure 7. Antagonistic activity of E. coli Nissle 1917 (EcN) in humans, as shown by the effect of preventive administration of EcN on the colonization of the newborn's gut with true and potential microbial pathogens (Citation96). Using a double-blind study design, 54 full-term newborns were randomly assigned to two treatment groups and received orally either 1 ml of an EcN suspension (108 cfu, black bars) or 1 ml of a placebo suspension (open bars) once a day for the first 5 days of life. During the hospital stay (on days 1, 2, 3, and 5) and thereafter (on day 21 and during the 6th month), colonization of the gut with true and potential microbial pathogens was determined in fecal samples and is presented as the percentage of children carrying pathogenic and potentially pathogenic microorganisms. Regarding the colonization with pathogens, differences between the EcN group and the placebo group were recognized first on day 2 and were significant on day 3 (15% vs 57%, p < 0.003), day 5 (15% vs 62%, p < 0.001), and after 6 months (28% vs 85%, p < 0.002). On day 21, the difference amounted to 33% vs 47%, but this was not significant. *Significantly different colonization between EcN and placebo groups.
Figure 8. Structural organization of the chromosomal gene clusters located on GEI I, encoding the components necessary for synthesis, export, and regulation of microcins H47 and M of E. coli Nissle 1917 (EcN) (Citation79). The number of amino acids (aa) of the individual gene products of the corresponding genes are given on top of the figure. The microcin M gene cluster (‘M’ from Mutaflor) was discovered for the first time in the EcN strain.
Figure 9. Inhibition of Salmonella typhimurium (S.T.) invasion into INT407 intestinal epithelial cells by E. coli Nissle 1917 (EcN) (Citation99,Citation100). (a) Cell cultures with INT407 cells were separately incubated with either E. coli K-12 or EcN, or with the S. typhimurium strains C17 or LT2. While both non-pathogenic E. coli strains were also non-invasive, the Salmonella typhimurium strains showed differently strong invasive activity. (b) Co-incubation of INT407 cells with E. coli K-12 and S. typhimurium C17, EcN and S. typhimurium C17, E. coli K-12 and S. typhimurium LT2, and EcN and S. typhimurium LT2. While co-incubation with E. coli K-12 had no effect on the invasive activity of the S. typhimurium strains, co-incubation with EcN markedly inhibited the invasive activity of both S. typhimurium strains. (c) As shown by cell culture experiments using a transwell system (left), the anti-invasive activity of EcN is not due to direct interaction between EcN and S. typhimurium nor to occupation of receptor sites by EcN at the epithelial surface, since the effect was still present after separating EcN from S. typhimurium and from the intestinal cells as well (right).
Figure 10. Anti-inflammatory effects of E. coli Nissle 1917 (EcN) on human peripheral blood T cells (PBT) in vitro, as shown by cytokine expression profiles induced by EcN-conditioned medium (EcN-CM) (Citation112). EcN-CM was obtained after 2 h incubation of EcN bacteria in T-cell medium (RPMI with 10% FCS, 1.5% HEPES) at 37°C and 5% CO2. Thereafter, bacteria were removed by centrifugation. The resulting supernatant was sterile-filtered through a filter of 0.22 μm pore size. The sterile-filtered supernatant (EcN-CM) was added to freshly isolated PBT (105 cells) in different concentrations (open bars, controls = no addition of EcN-CM; hatched bars, 10% v/v EcN-CM; black bars, 25% v/v EcN-CM). T cells were then stimulated by adding anti-CD3-mAb and cultured for 3 days in RPMI. Culture supernatants were collected and assayed for cytokines. EcN-CM dose-dependently and significantly inhibited IL-2, TNF-α, and IFN-γ synthesis, while IL-10 production was markedly up-regulated. *p < 0.05 vs CD3 controls.
Figure 11. Immunomodulatory activities of gram-positive (bifidobacteria, lactobacilli) and gram-negative (E. coli Nissle 1917, EcN) bacteria on human peripheral blood mononuclear cells (PBMNCs) in vitro (Citation107). Supernatant concentrations of the cytokines IL-10 and TNF-α after co-incubation of PBMNCs with cell debris of bacteria from different genera and species are shown. With regard to bifidobacteria (open bars), results are pooled from the data obtained by testing B. breve, B. infantis, and B. longum. With regard to lactobacilli (hatched bars), results are pooled from the data obtained by testing L. acidophilus, L. bulgaricus, L. casei, L. plantarum, and L. rhamnosus strain GG (LGG). Data from experiments with E. coli Nissle 1917 (EcN) are presented by the black bars. Concentrations of IL-10 and TNF-α are shown in pg/ml as area under the curve (AUC, mean ± SE). *Significantly different, p < 0.05.
Figure 12. Effect of intentional colonization of the gut of newborns by E. coli Nissle 1917 (EcN) on the levels of secretory IgA and IgM (Citation121). One ml of EcN suspension (108 cfu/ml) was administered p.o. once a day for 5 days, starting from the first day of life. IgA and IgM levels against EcN antigen were measured in stool filtrates after colonization of full-term and preterm infants with EcN and compared to the IgA and IgM levels in stool filtrates of non-colonized preterm infants (controls). Antibody levels are expressed as percentage of the reference sample (mean ± SE). In stool filtrates of full-term infants IgA and IgM levels were significantly higher (from day 3 onwards) than the levels detected before colonization (p < 0.05). IgA levels were significantly higher in full-term than in preterm infants on day 5 and day 14 (p < 0.01), and IgM levels were higher on all days after colonization (p < 0.05 ... p < 0.01). Preterm colonized infants had higher fecal IgA and IgM titers than non-colonized preterm infants (controls) on all days after colonization (p < 0.05 ... p < 0.01).
Table V. Effects of live and heat-killed E. coli Nissle 1917 (EcN) and of EcN-DNA on DSS-induced colitis in specific pathogen-free C57BL/6 mice.
Figure 13. Anti-inflammatory action of E. coli Nissle 1917 (EcN) in immunodeficient C.B.-17 SCID mice with chronic colitis (Citation129). Chronic colitis was induced by adoptive T-cell transfer, using purified CD4+ CD62L+ splenic T lymphocytes from healthy BALB/c mice, which were introduced intraperitoneally into recipient SCID mice. After T-cell transfer, mice were divided into two groups. The first group received 200 μl of EcN suspension (5 × 10¹⁰ cfu/ml) by gastric gavage twice per week from week 1 post-transfer to week 8 at the end of the experiment (= T-cell transfer mice + EcN, black bars). The second group of SCID mice was treated in the same way and for the same period of time, but received plain water by gastric gavage instead of EcN (= T-cell transfer mice - EcN, open bars). This second group served as positive control (colitis mice). Healthy BALB/c mice were treated intraperitoneally with PBS (phosphate-buffered saline) instead of splenic T cells, and thereafter received EcN by the oral route (= PBS-treated healthy mice + EcN, gray bars). These mice served as negative controls. (a) Clinical score of CD4+ CD62L+ SCID mice treated or not treated with EcN p.o., in comparison to the score of the healthy control group injected i.p. with PBS and treated with EcN p.o. *p < 0.001 vs CD62L. (b) Histological score of the colonic inflammation in mice following the induction of colitis by transfer of naïve CD4+ CD62L+ T lymphocytes and p.o. administration of EcN, compared to that of colitis mice not treated with EcN, and to the healthy control group which received an i.p. injection of PBS and was treated with EcN p.o. *p < 0.02 vs CD62L. (c) Evidence of bacterial translocation into mesenteric lymph nodes (MLNs). Total concentration of E. coli-like colonies in MLNs of mice from the transfer model following oral administration of EcN for 8 weeks compared to that of colitis mice not treated with EcN. EcN was identified by REP-PCR. *p < 0.0001 vs CD62L. (d, e, f) Proinflammatory cytokine secretion from MLNs following the induction of colitis in SCID mice by transfer of naïve CD4+ CD62L+ T lymphocytes. Anti-inflammatory effect of the p.o. administration of EcN, compared to the results obtained in colitis mice not treated with EcN, and to the healthy control group which received an i.p. injection of PBS and was treated with EcN p.o. Values given are means ± SEM (pg/ml). (d) IFN-γ, *p < 0.03 vs CD62L; (e) IL-6, *p = 0.02 vs CD62L; (f) IL-5, *p = 0.02 vs CD62L.
Figure 14. Augmentation of host defense against systemic bacterial and fungal infections in mice by oral pretreatment with E. coli Nissle 1917 (EcN) (Citation132). Four groups of mice were pretreated once with 106, 107, 108, or 109 viable cells of EcN by oral administration, before they were challenged 24 h later by intravenous infection with Listeria monocytogenes (6 × 10³ cfu) or Candida albicans (5 × 10⁵ cfu). For each infection model, further groups of mice served as controls. These were either pretreated with placebo (negative controls, open bars) or with murine IFN-γ (positive controls, gray bars). Three days after infection with L. monocytogenes and 1 day after infection with C. albicans, mice were sacrificed and the parasite burden of the respective main target organs was determined. Compared with placebo, the pretreatment with IFN-γ resulted in a significant decrease of parasite load in spleen and liver of mice infected with L. monocytogenes, and a significant decrease of C. albicans counts in the kidneys. Likewise, pretreatment with EcN via the oral route significantly and dose-dependently reduced the parasite burden in spleen, liver, and kidneys. *p < 0.05 vs negative controls.
Figure 15. Effects of the non-pathogenic E. coli strain Nissle 1917 (EcN) and the enteropathogenic E. coli (EPEC) strain E2348/69 on the distribution of the tight junction protein zonula occludens-2 (ZO-2) in T84 epithelial cells (Citation115). T84 monolayers were incubated with bacteria for different periods of time and stained for ZO-2 using a fluorescent anti-ZO-2 antibody. (A) Control, T84 epithelial cells without bacteria. (B) T84 cells incubated with EPEC for 120 min. (C) T84 cells incubated with EcN for 120 min. (D) T84 cells incubated with EPEC for 60 min, then washed and further incubated with regular medium for another 60 min. (E) T84 cells incubated with EPEC for 60 min, then washed and further incubated with EcN for another 60 min. (F) T84 cells co-incubated with EcN plus EPEC for 120 min. Bacteria were added in a 1:1 ratio. The EcN strain had no negative influence on the distribution of the tight junction protein ZO-2, but abolished the negative impact of EPEC on ZO-2 distribution.
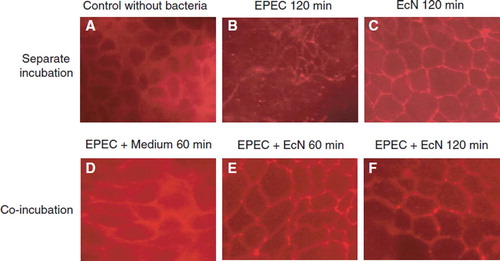
Figure 16. Stimulation of human β-defensin-2 (HBD-2) gene transcription in Caco-2 intestinal epithelial cells by pathogenic (EPEC E2348/69, UPEC 536) and non-pathogenic E. coli strains (E. coli K-12 DSM 498, EcN), and by E. coli strains with unknown pathogenicity (fecal isolates from healthy persons (PZ 860-915) and colitis ulcerosa patients (PZ 830, 835) (Citation114,Citation138). Caco-2 cells were stimulated for 4.5 h with 3 × 10⁸ heat-inactivated bacteria/ml. Transcription of the HBD-2 gene was analyzed by real-time PCR. HBD-2 gene expression is shown after stimulation by the different E. coli strains, including probiotic E. coli Nissle 1917 (EcN). Data represent the means ± SEM normalized to the basal expression of controls (set at 1) from one to six separate experiments run in triplicate. *p = 0.0006; **p < 0.0001.
Figure 17. Inhibition of ‘leaky gut’ phenomena by oral administration of E. coli Nissle 1917 (EcN) to mice with dextran sodium sulfate (DSS)-induced colitis (Citation130). Intestinal permeability to Evans Blue was determined in healthy mice (control, open bar), mice with DSS-induced colitis (hatched bar), and mice treated with DSS plus EcN (black bar). Compared with healthy control mice, a significant increase in the uptake of Evans Blue by the colonic mucosa of DSS-treated mice was observed. This increase was strongly reduced in the group of mice treated with DSS plus EcN to almost normal values. ***p < 0.001.
Figure 18. Schematic summary of pharmacodynamic activities of probiotic E. coli strain Nissle 1917 (EcN) in the gut lumen (antagonistic activity), and at the intestinal epithelium and beyond (host cell signaling).
Figure 19. Biofilm formation by E. coli Nissle 1917 (EcN) in vitro as demonstrated by laser scanning microscopy. (A) Computer-assisted height measurement; (B) density measurement. Pictures taken from: J. Schulze, M. Schiemann, U. Sonnenborn. 120 years of E. coli – its importance in research and medicine. Alfred-Nissle-Gesellschaft, editor. Hagen, p 33, 2006; with kind permission. Scanning micrographs courtesy of U. Dobrindt and H. Merkert, University of Wuerzburg, Germany.
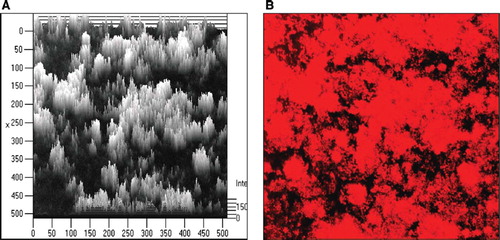
Table VI. Biosafety aspects of E. coli strain Nissle 1917 (EcN) important for preventive and therapeutic use in human and veterinary medicine.
Table VII. Comparison of E. coli strain Nissle 1917 (EcN) with non-pathogenic and uropathogenic E. coli (UPEC) strains in vitro and in a rat transurethral infection model.
Table VIII. Sensitivity and resistance of E. coli Nissle 1917 (EcN) against different antibiotics*.
Table IX. Test of the ability of E. coli Nissle 1917 (EcN) to serve as a recipient for foreign plasmid DNA.
Figure 20. Comparison of mesalazine (5-aminosalicylic acid, 5-ASA) vs E. coli Nissle 1917 (EcN) for remission maintenance in patients with ulcerative colitis (Citation242). A total of 116 patients with active ulcerative colitis were randomly assigned to one of two treatment groups in a double-blind clinical trial with double-dummy design. Patients who had reached remission by standard corticosteroid therapy within 12 weeks were then given either mesalazine or EcN for 1 year. The Kaplan–Meier plot shows the percentage of patients in remission during the course of the study (straight line, EcN; dotted line, mesalazine). With respect to clinical efficacy and time course of remission, there were no statistically significant differences between the two study groups.
Figure 21. Clinical equivalence study between mesalazine (5-aminosalicylic acid, 5-ASA) and E. coli Nissle 1917 (EcN) for maintaining remission of ulcerative colitis (Citation155). A total of 327 patients with quiescent ulcerative colitis were recruited and randomly assigned to a double-blind clinical multicenter trial with double-dummy design that was performed in 10 European countries. Patients received either mesalazine or EcN for 1 year. At the end of the study, 222 patients could be included in the per-protocol analysis. Of these, 40/110 (36.4%) in the EcN group and 38/112 (33.9%) in the mesalazine group showed a relapse during the 1-year period of treatment. The data show significant equivalence between both treatment groups with respect to clinical efficacy (maintenance of remission) (p = 0.003).
Figure 22. Double-blind placebo-controlled randomized clinical trial with E. coli Nissle 1917 (EcN) for the treatment of chronic habitual constipation (Citation250). Initially, all constipated patients (n = 134, two bowel movements per week or less) in a blinded manner received a placebo medication for 1 week which, however, was handed over to them by the principal investigator as a ‘new biological drug against constipation’. After the 1-week course on placebo, only those patients who did not respond to this treatment (n = 70) were allowed to enter the real double-blind study and were randomly assigned to receive either EcN or placebo. The figure shows the development of the main target criterion (number of bowel movements per week) during the 8-week course of the study. EcN was significantly better than placebo in increasing the weekly frequency of bowel movements after 4 and after 8 weeks on medication (p < 0.001 for EcN vs placebo).
Figure 23. Two double-blind placebo-controlled randomized clinical trials have been performed with E. coli Nissle 1917 (EcN) suspension (108 cfu/ml) for the treatment of acute diarrhea (A) or prolonged diarrhea (B) in young children (Citation252,Citation253) (see text for details). In the study on acute diarrhea (A), EcN treatment shortened the duration of diarrhea by 2.3 days compared with placebo (p < 0.0007). In the study on prolonged diarrhea (B), EcN treatment shortened the duration of diarrhea by 3.3 days (p < 0.0001). These results demonstrate that EcN suspension is an effective treatment option for diarrheal diseases in infants.