Figures & data
Figure 1. C5aR is a therapeutic target in DTHA. (A) DTHA was induced by modification of a classical mBSA-induced DTH response. Mice were immunised with mBSA in CFA on day -7, and the modification consisted of giving the mice a sub-arthritogenic dose of an anti-type II collagen mAb cocktail (anti-CII) or isotype control cocktail i.v. on day-3. Challenge with mBSA in the right hind foot pad was done on day 0. (B) Temporal course of the DTH response. The group given isotype control Ab cocktail developed only an acute DTH response. Paw and ankle swelling was calculated as the swelling on a given day, minus the swelling on day 0. Mean ± 95% CI shown, n = 24 (anti-CII group) and n = 6 (isotype control group). (C) C5a-production is upregulated in the arthritic paw in DTHA compared to naïve controls, measured by ELISA in whole-paw homogenate supernatants. Mean shown, n = 5. ***: p ≤ 0.001, one-way ANOVA. (D) Median fluorescence intensity (MFI) of FITC conjugated to C5aR measured by flow cytometry on neutrophils (PMN) and macrophages (Mϕ) in the lymph node draining the arthritic paw (dLN), in paw infiltrate and in blood, measured 72 h after arthritis induction. Neutrophils were gated as CD45+CD19−CD11b+Ly6G+, macrophages as CD45+CD19−CD11b+Ly6G−F4/80+ and monocytes in blood as CD45+CD19−CD11b+Ly6G−SSClowFSCint. Mean shown, n = 5–10. (E) Representative flow cytometry histograms showing the mean fluorescence intensity (MFI) of FITC conjugated to either anti-C5aR or isotype control antibody. (F) Blood neutrophil count in DTHA measured by flow cytometry. Dotted line represents blood neutrophil count in naïve mice and grey shading 95% CI (mean: 251,968 cells/ml, 95% CI: 177,173–326,763 cells/ml). Mean ± 95% CI shown, n = 10. (G) Myeloperoxidase measured in whole-paw homogenate supernatants by ELISA. Mean ± 95% CI shown, n = 10. Dotted line represents levels in naïve mice and grey shading 95% CI (mean: 9.077 µg/g, 95% CI: 7.440–10.715 µg/g, n = 10).
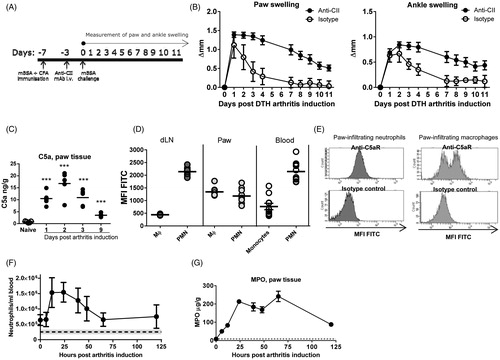
Figure 2. Treatment with anti-C5aR mAb ameliorates DTH arthritis. (A) Therapeutic treatment with 500 µg/mouse of anti-C5aR or isotype control Ab (IgG2a.1) was started at time of challenge and continued until day 11 post arthritis induction where the study was terminated. (B) Treatment with anti-C5aR ameliorated DTHA when begun at arthritis induction. Area under curve (AUC) values calculated from individual swelling curves over days 0–11. Mean ± SEM shown, n = 10. *: p ≤ 0.05; **: p ≤ 0.01; ***: p ≤ 0.001, Student’s t-test. (C) Semi-quantitative histopathological scoring of arthritic and inflammatory parameters in the two treatment groups at study termination on a scale of 0–3 (see “Materials and methods” section for details), n = 10. *: p ≤ 0.05; **: p ≤ 0.01; ***: p ≤ 0.001, Student’s t-test with Welch’s correction. (D) Sum of the individual scores in C). Maximum possible score is 15. n = 10. ***: p ≤ 0.001, Student’s t-test with Welch’s correction. (E) Images show the metatarsal joint from the paw of a mouse from the C5aR-treated group and a mouse from the IgG2a.1-treated control group with an arthritis sum score of 3.5 (mean: 2.8), and 8 (mean: 6.8), respectively, at study termination on day 11. Arrows point towards areas of cartilage destruction in the images of Safranin O stains and towards TRAP-positive osteoclasts in the images of TRAP stains. The stars indicate areas of extra-articular inflammation. BM: bone marrow; S: synovium. Magnification 10Χ, scale bar represents 600 µm. (F) Levels of C5a protein in whole-paw homogenate supernatants in the two treatment groups measured by ELISA. Mean ± SEM shown, n = 10. *: p ≤ 0.05; **: p ≤ 0.01, Student’s t-test. (G) Levels of the acute-phase protein serum amyloid P component (SAP) in serum from the two treatment groups by ELISA. Mean ± SEM shown, n = 10. *: p ≤ 0.05, Student’s t-test.
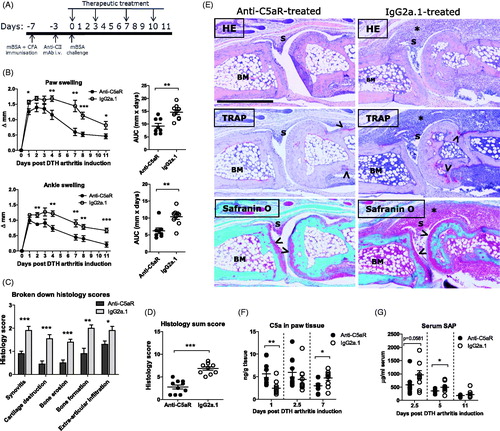
Figure 3. Disease activity in DTHA is reduced 60 h following a single dose of anti-C5aR mAb. (A) Area under curve (AUC) of paw- and ankle swelling, measured every day until 60 h after arthritis induction. Mean ± SEM shown, n = 10. *: p ≤ 0.05; **: p ≤ 0.01, Student’s t-test. (B) Semi-quantitative histopathology scoring of arthritic and inflammatory parameters in the two treatment groups on a scale of 0–3 (see Material and methods for details). n = 10. *: p ≤ 0.05; **: p ≤ 0.01; ***: p ≤ 0.001, Student’s t-test with Welch’s correction. (C) Sum of the individual scores in B (arthritis sum score), and sum of the individual scores in B minus extra articular infiltration (arthritis score). Maximum possible score is 15 and 9, respectively. n = 10. *: p ≤ 0.05; **: p ≤ 0.01, Student’s t-test with Welch’s correction. (D) Images show the metatarsal joint from the paw of a mouse from the C5aR-treated group and a mouse from the IgG2a.1-treated control group with an arthritis sum score of 3 (mean: 5.6), and 6 (mean: 8.1), respectively, at study termination at 60 h post arthritis induction. Arrows point towards areas of cartilage destruction in the images of Safranin O stains and towards TRAP-positive osteoclasts in the images of TRAP stains. The stars indicate extra-articular inflammation. BM: bone marrow; S: synovium. Magnification 10×, scale bar represents 600 µm. (E) Levels of receptor-activator of nuclear factor κB ligand (RANKL) protein in whole-paw homogenate supernatants from the two treatment groups measured by ELISA. Mean ± SEM shown, n = 10. **: p ≤ 0.01, Student’s t-test. (F) Levels of myeloperoxidase (MPO) protein in whole-paw homogenate supernatants measured by ELISA. Mean ± SEM shown, n = 10, ***: p ≤ 0.001, Student’s t-test. (G) Neutrophil and T cell counts in blood of mice treated with anti-C5aR or IgG2a.1. Neutrophils were defined as CD45+CD11b+Ly6G+ and T cells as CD45+TCRβ+. Mean ± SEM shown, n = 10. *: p ≤ 0.05, Student’s t-test. (H) Total leukocyte, neutrophil and CD4+ T cell count in the popliteal lymph node draining the arthritic paw (dPLN) in mice treated with anti-C5aR or IgG2a.1. Neutrophils and T cells defined as above. Mean ± SEM shown, n = 10. *: p ≤ 0.05, Student’s t-test.
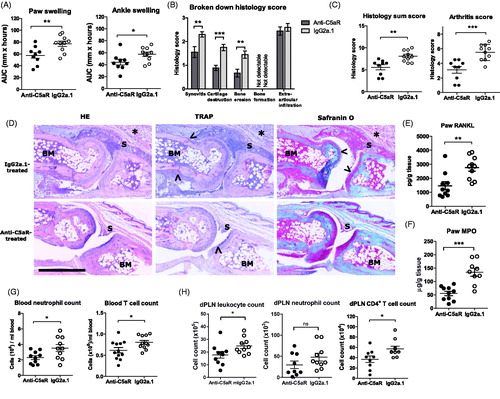
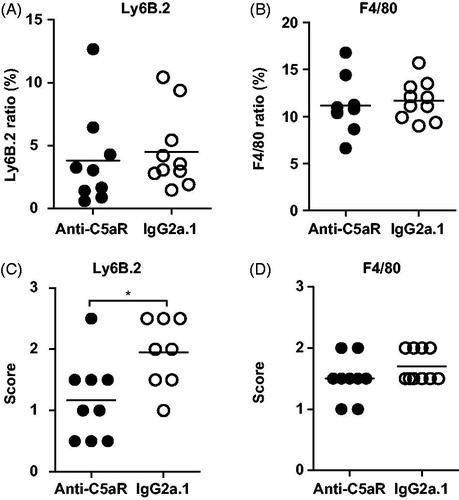
Figure 4. Anti-C5aR treatment reduces neutrophil infiltration into joints, but not total quantity of neutrophils and macrophages in paws. Digitalised image analysis (see “Materials and Methods” section for details) of (A) neutrophils (Ly6B.2) and (B) macrophages (F4/80) in DTHA paws at 60 h post arthritis induction after a single dose of anti-C5aR or isotype control antibody. The results are given as tissue area stained positive for F4/80 and Ly6B.2 of the entire paw area (%). Mean shown, n = 9–10. Semi-quantitative visual scoring (see Materials and Methods for details) of (C) neutrophil infiltration and (D) macrophage infiltration into the joint space and synovium of DTHA paws at 60 h post arthritis induction after a single dose of anti-C5aR or isotype control antibody. Evaluation was performed on Ly6B.2-stained (C) and F4/80 (D) sections. Range 0–3. Mean ± SEM shown, n = 9–10. *: p ≤ 0.05, Student’s t-test with Welch’s correction.