Figures & data
Table 1. Ready-mix ingredients [reproduced with permission from Brorby et al. (Citation2008)].
Figure 1. Time course of the study design. Following the 5 days of exposure, the first time point for postexposure analysis was immediately following the end of the 5th day of exposure. This was termed day 0 of the nontreatment post-exposure period. As described below, this is the first time point at which fiber lung burden and histopathology was analyzed.
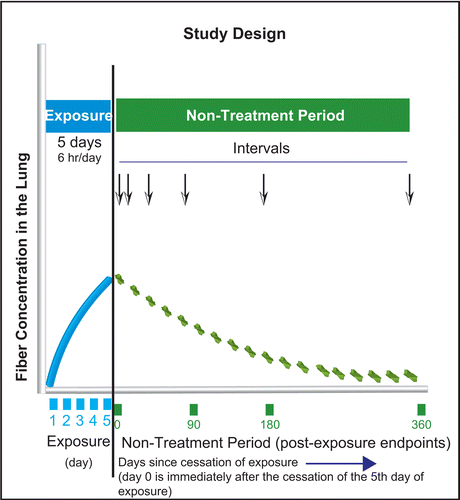
Table 2. Postexposure end points analyzed in subgroups of rats at each time points shown.
Figure 2. Shown is one of the diaphragms and the region that was sampled for analysis using the biopsy punch. The rulers (1–4 cm) provide an indication of the size and sampling location. The biopsy punch was 10 mm diameter.
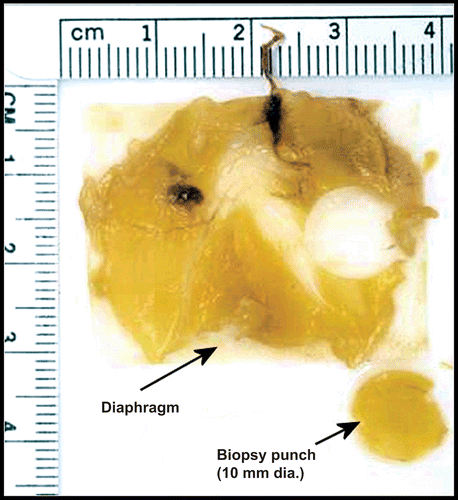
Table 3. Aerosol concentration and size distribution of the air control, CSP, and amosite inhalation exposure atmospheres.
Figure 3. The mean number of fibers in the exposure atmospheres in each of the three length categories < 5 µm, 5–20 µm and > 20 µm are illustrated for the chrysotile and amosite aerosols.
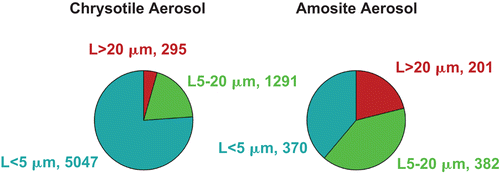
Figure 4. The bivariate length and diameter size distributions of chrysotile fibers and sanded joint compound particles aerosol and the amosite aerosol.
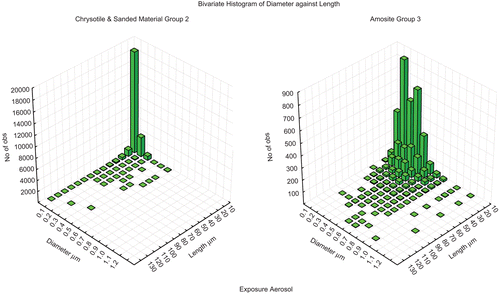
Table 4. CSP exposed lungs—mean concentrations and dimensions of the fibers recovered from the lungs at each time point.
Table 5. Amosite-exposed lungs—mean concentrations and dimensions of the fibers recovered from the lungs at each time point.
Figure 5. The bivariate length and diameter histograms (sum of all lungs in that group at each time point) of the number of fibers remaining in the lungs of chrysotile fibers and sanded joint compound particles exposed animals at 0, 1, 14, and 90 days following cessation of exposure.
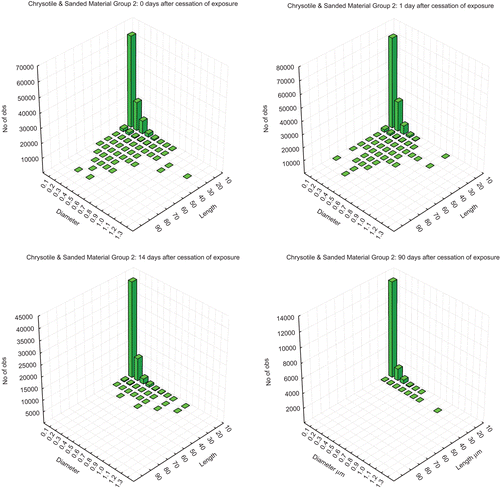
Figure 6. The bivariate length and diameter histograms (sum of all lungs in that group at each time point) of the number of fibers remaining in the lungs of the amosite-exposed animals at 0, 1, 14, and 90 days following cessation of exposure.
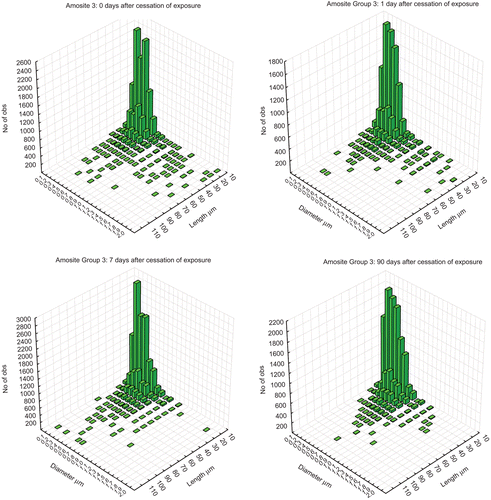
Figure 7. Clearance of fibers longer than 20 µm from chrysotile fibers and sanded joint compound particles-exposure group (group 2) and the amosite-exposure group (group 3).
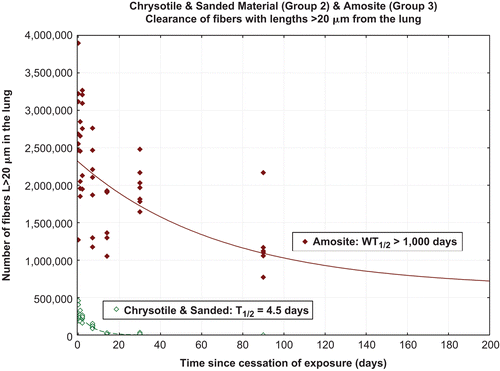
Figure 8. Clearance of fibers 5–20 µm in length from chrysotile fibers and sanded joint compound particles (group 2) and the amosite-(group 3).
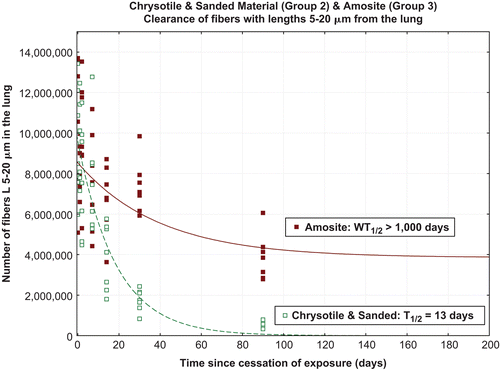
Figure 9. Clearance of fibers shorter than 5 µm from chrysotile fibers and sanded joint compound particles (group 2) and the amosite (group 3).
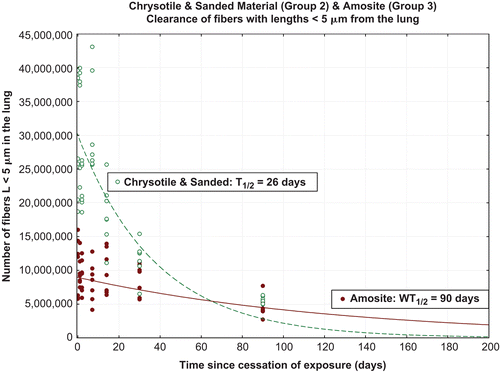
Table 6. Histopathological findings in the lung at 0, 7, 14, 28, and 90 days postexposure in the air control animals (group 1), the CSP animals (group 2), and the amosite asbestos-exposed animals (group 3).
Figure 10. Histopathological photomicrographs: on the left is a control lung at 28 days following cessation of exposure. On the right is a lung from the chrysotile fibers and sanded joint compound particles group at 90 days following cessation of exposure. In the upper right-hand corner is a terminal bronchiole leading through the bronchiolar alveolar junction into the alveoli. A few macrophages can be seen in some of the alveoli (magnification 40×).
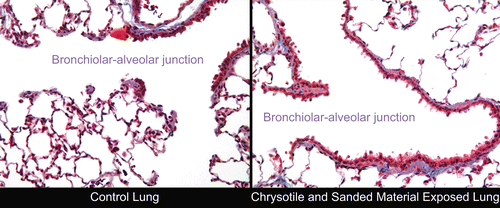
Figure 11. Histopathological photomicrographs: microgranuloma observed in an amosite-exposed lung at 28 and 90 days postexposure. Left pane at lower magnification of 20× or 40×. Right pane at a magnification of 100× showing at 28 days collagen developing in the granuloma (blue color). The right pane at 90 days shows granuloma with collagen deposition sufficient to be characterized as interstitial fibrosis.
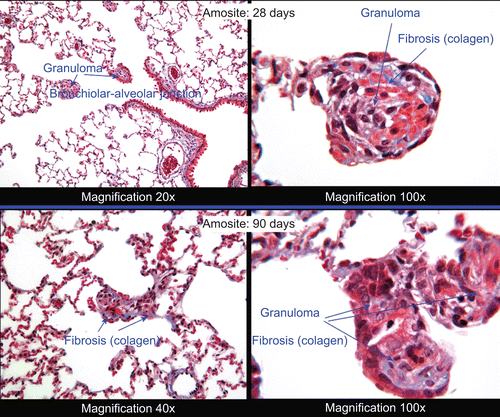
Table 7. Confocal analysis—for CSP the estimated mean total number of fibers in the parenchyma and in the airway of the lung as extrapolated from the confocal microscopy measurements.
Figure 12. Distribution of fibers in the airways by subcompartment as a function of time after cessation of exposure for chrysotile fibers and sanded joint compound particles compared to the amosite asbestos exposure group.
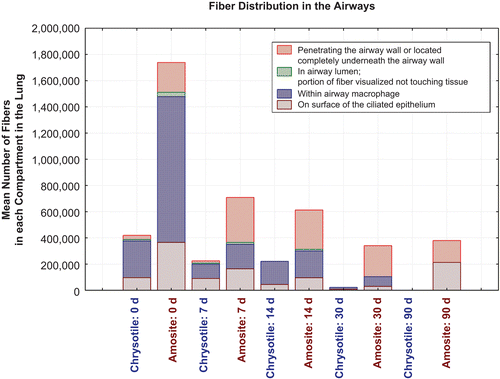
Figure 13. Distribution of fibers in the parenchyma by subcompartment as a function of time after cessation of exposure for chrysotile fibers and sanded joint compound particles compared to the amosite asbestos exposure group.
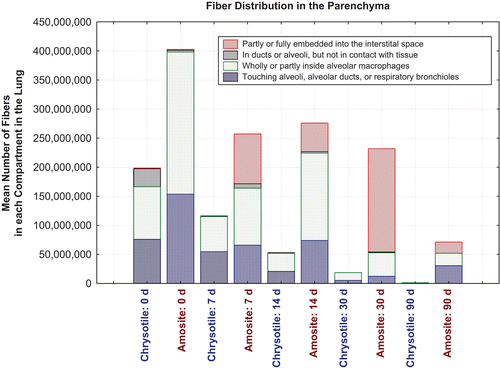
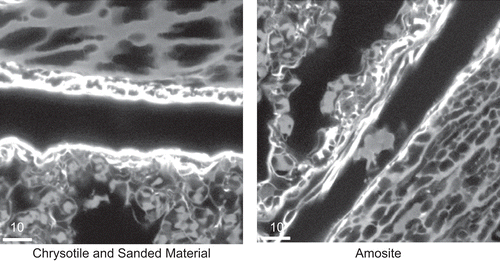
Figure 14. Day 0—chrysotile: small fibers and particles are seen along with a number of macrophages which are likely phagocytizing the small fibers and particles. Amosite: a very long amosite fiber in the alveolar duct surrounded by numerous macrophages. The micron bar in the lower right corner is 10 µm in length.
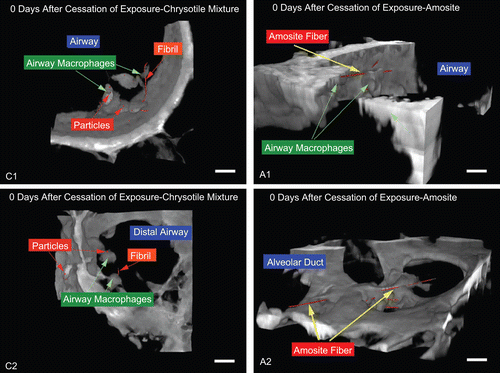
Figure 15. 30 and 90 days—chrysotile: airway macrophages are noted although no chrysotile fibers are evident. Amosite: long amosite fibers are seen embedded in the interstitium and the cellular matrix. The micron bar in the lower right corner is 10 µm in length.
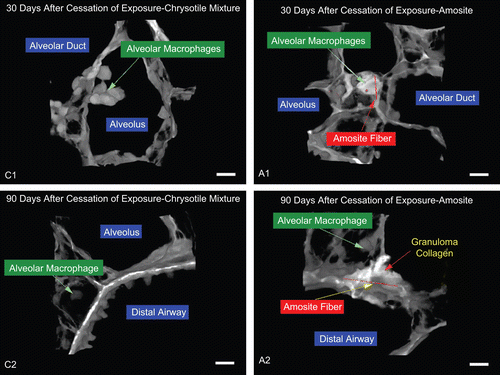
Figure 16. images of the diaphragm surface at 0 days immediately after cessation of exposure for the air control, the chrysotile fibers and sanded joint compound particles group, and the amosite group. At this time point there is no distinction among the diaphragms from the three groups. The micron bar in the lower right corner is 10 µm in length.

Figure 17. Confocal image of the amosite-exposure group at 7 days after cessation of exposure. Amosite fibers with an accompanying macrophage inflammatory response are seen already. The micron bar in the lower right corner is 10 µm in length.
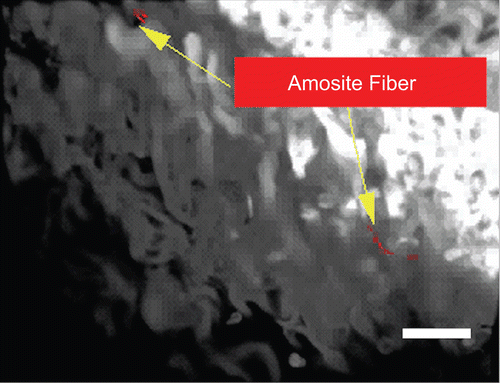
Figure 18. The diaphragms from the amosite-exposed group at 14, 30 and 90 days after cessation of exposure show increasing cellular proliferation on the surface. The micron bar in the lower right corner is 10 µm in length (the bar sort of blends in with the photo). The chrysotile fibers and sanded joint compound particles group was not different from the air control.

Figure 19. Scanning electron micrograph of the diaphragm from amosite-exposed group at 90 days after cessation of exposure. The surface of the amosite-exposed diaphragm shows extensive inflammatory proliferation with numerous activated inflammatory cells. The micron bar is 2 µm in length.
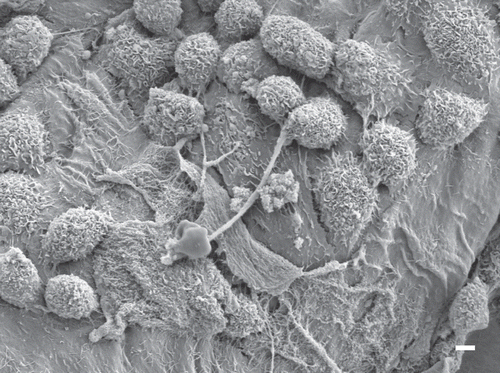
Figure 20. Chest wall: low temperature photomicrographs of the pleural space were recorded at selected locations to examine the presence of possible intrapleural pathology and inflammatory cells. The pleural space was surveyed for the presence of inflammatory cell accumulation and foreign bodies/fibers. The micron bar in the lower left corner is 10 µm in length.
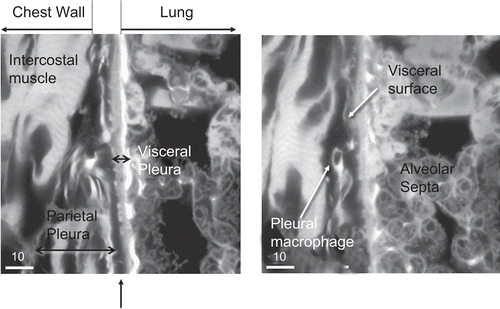
Figure 21. Representative images of the pleural space at 181 days after cessation of exposure for the chrysotile fibers and sanded joint compound particles group and the amosite group. No inflammatory cells were observed in the pleural space of the CSP exposed animal. The right-hand image is from an amosite-exposed animal and shows a mass of inflammatory cells within the pleural space. The micron bar in the lower left corner is 10 µm in length.
