Publication Cover
Inhalation Toxicology
International Forum for Respiratory Research
Volume 23, 2011 - Issue 7
2,064
Views
31
CrossRef citations to date
0
Altmetric
Research Article

Quantification of the pathological response and fate in the lung and pleura of chrysotile in combination with fine particles compared to amosite-asbestos following short-term inhalation exposure

, , , , , , , & show all
Pages 372-391 | Received 25 Feb 2011, Accepted 23 Mar 2011, Published online: 03 Jun 2011

Figures & data

Table 1.  Postexposure end points analyzed in subgroups of rats at each time points shown.

Figure 1.  Comparison of the size distribution as determined by TEM of the original chrysotile sample (Brorby, personal communication) with that of the chrysotile aerosol to which the animals were exposed in this study.
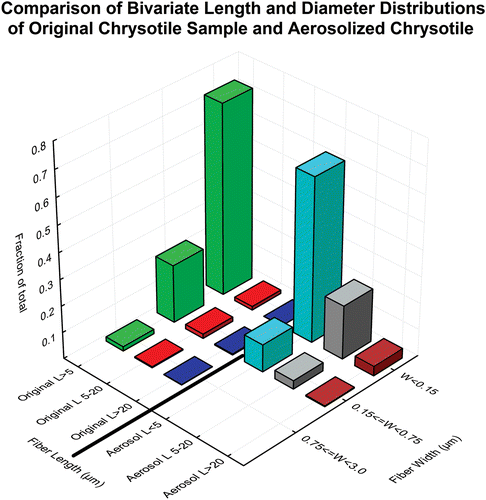
Figure 1.  Comparison of the size distribution as determined by TEM of the original chrysotile sample (Brorby, personal communication) with that of the chrysotile aerosol to which the animals were exposed in this study.

Table 2.  Aerosol concentration and size distribution of the air control, CSP, and amosite inhalation exposure atmospheres.

Figure 2.  The mean number of fibers in the exposure atmospheres in each of the three length categories < 5 µm, 5–20 µm, and > 20 µm are illustrated for the CSP and amosite aerosols.
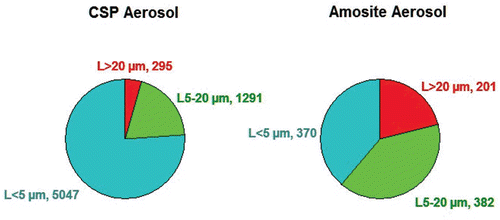
Figure 2.  The mean number of fibers in the exposure atmospheres in each of the three length categories < 5 µm, 5–20 µm, and > 20 µm are illustrated for the CSP and amosite aerosols.

Table 3.  CSP-exposed lungs—mean concentrations and dimensions of the fibers recovered from the lungs at each time point.

Table 4.  Amosite-exposed lungs—mean concentrations and dimensions of the fibers recovered from the lungs at each time point.

Figure 3.  Bivariate length and diameter distribution of fibers in the CSP-exposed lungs, respectively, immediately after cessation of exposure (day 0) and at 365 days after cessation of exposure.
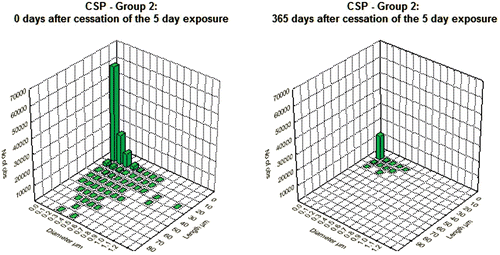
Figure 3.  Bivariate length and diameter distribution of fibers in the CSP-exposed lungs, respectively, immediately after cessation of exposure (day 0) and at 365 days after cessation of exposure.
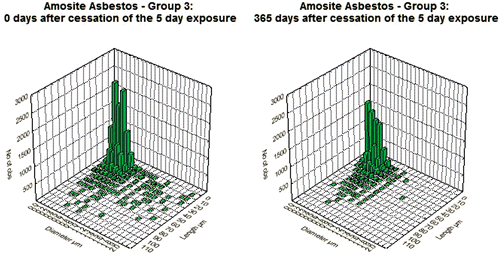
Figure 4.  Bivariate length and diameter distribution of fibers in the amosite-exposed lungs, respectively, immediately after cessation of exposure (day 0) and at 365 days after cessation of exposure.

Figure 4.  Bivariate length and diameter distribution of fibers in the amosite-exposed lungs, respectively, immediately after cessation of exposure (day 0) and at 365 days after cessation of exposure.

Figure 5.  The clearance of fibers from the lung through 365 days postexposure is shown for CSP-exposed animals. The data and clearance curves for fibers < 5 µm in length, fibers 5–20 µm in length, and fibers > 20 µm in length are presented. (Note that the axis for the number of fibers remaining in the lung > 20 µm is on the right side of the graph.)
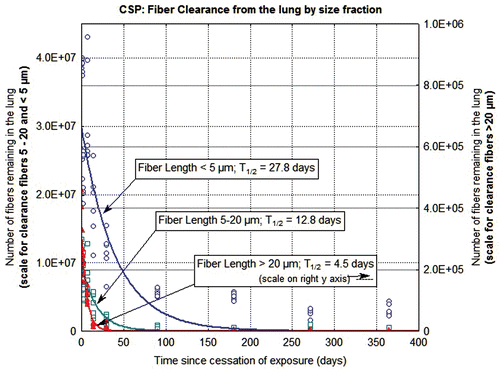
Figure 5.  The clearance of fibers from the lung through 365 days postexposure is shown for CSP-exposed animals. The data and clearance curves for fibers < 5 µm in length, fibers 5–20 µm in length, and fibers > 20 µm in length are presented. (Note that the axis for the number of fibers remaining in the lung > 20 µm is on the right side of the graph.)
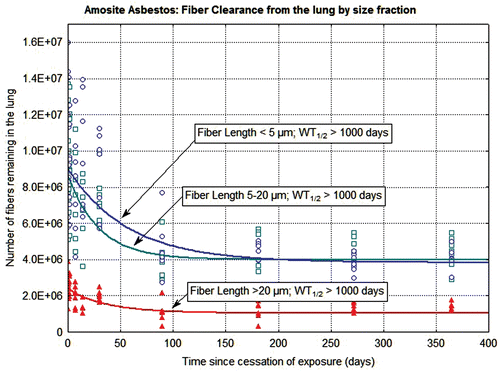
Figure 6.  The clearance of fibers from the lung through 365 days postexposure is shown for amosite-exposed animals. The data and clearance curves for fibers < 5 µm in length, fibers 5–20 µm in length, and fibers > 20 µm in length are presented.

Figure 6.  The clearance of fibers from the lung through 365 days postexposure is shown for amosite-exposed animals. The data and clearance curves for fibers < 5 µm in length, fibers 5–20 µm in length, and fibers > 20 µm in length are presented.

Figure 7.  The parietal pleural surface from an animal exposed to CSP at 90 days postexposure. An occasional macrophage is observed; however, there is no associated inflammatory response or lesions.
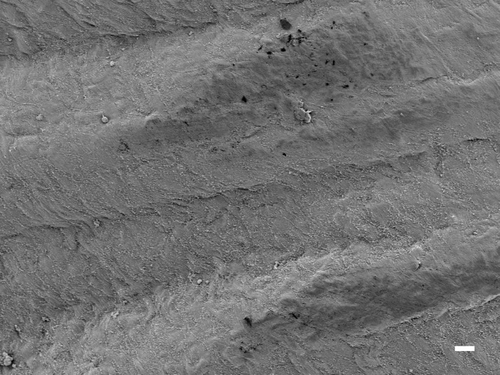
Figure 7.  The parietal pleural surface from an animal exposed to CSP at 90 days postexposure. An occasional macrophage is observed; however, there is no associated inflammatory response or lesions.

Figure 8.  The parietal pleural surface from an animal exposed to amosite asbestos at 14 days postexposure. A network of large activated macrophages, which have laid down a fibrin matrix, is observed.
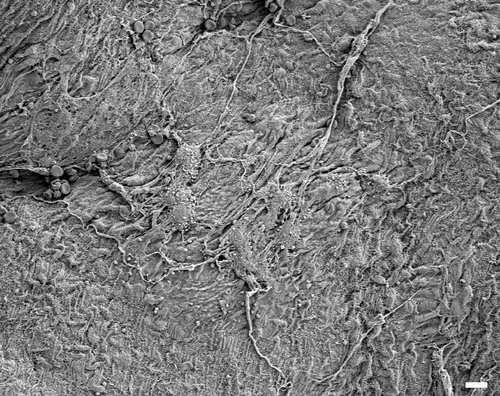
Figure 8.  The parietal pleural surface from an animal exposed to amosite asbestos at 14 days postexposure. A network of large activated macrophages, which have laid down a fibrin matrix, is observed.

Figure 9.  The parietal pleural surface from an animal exposed to amosite asbestos at 90 days postexposure. Numerous macrophages are observed on the parietal pleural (the triangular indentation seen in the micrograph was likely due to the back of a forceps, which was used for straightening the diaphragm after removal from the animal). Confocal imaging of the diaphragm indicated the presence of a number of amosite fibers in this region.
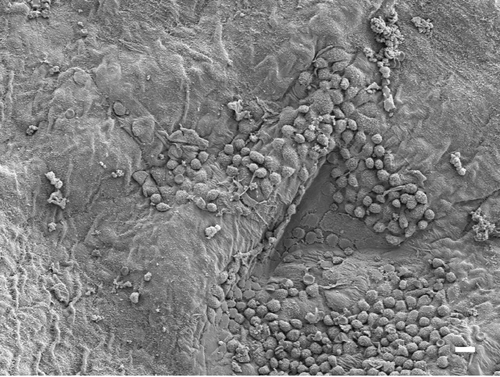
Figure 9.  The parietal pleural surface from an animal exposed to amosite asbestos at 90 days postexposure. Numerous macrophages are observed on the parietal pleural (the triangular indentation seen in the micrograph was likely due to the back of a forceps, which was used for straightening the diaphragm after removal from the animal). Confocal imaging of the diaphragm indicated the presence of a number of amosite fibers in this region.

Figure 10.  The thickness of the pleural wall measured at between 5 and 10 points in each section examined is shown for the air control, CSP, and amosite asbestos-exposed groups. The mean visceral wall thickness of the amosite-exposed group was statistically larger than the mean visceral wall thickness of the chrysotile or air-control groups (Dunnett’s T-test, P < 0.01).
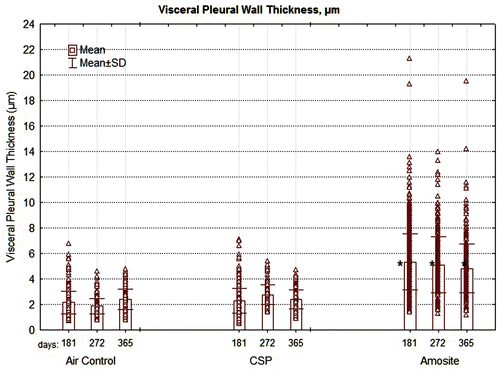
Figure 10.  The thickness of the pleural wall measured at between 5 and 10 points in each section examined is shown for the air control, CSP, and amosite asbestos-exposed groups. The mean visceral wall thickness of the amosite-exposed group was statistically larger than the mean visceral wall thickness of the chrysotile or air-control groups (Dunnett’s T-test, P < 0.01).

Figure 11.  The average number of pleural defects per field of view (average field of view was 0.0075 mm2) is shown for the air control, CSP, and amosite asbestos-exposed groups.
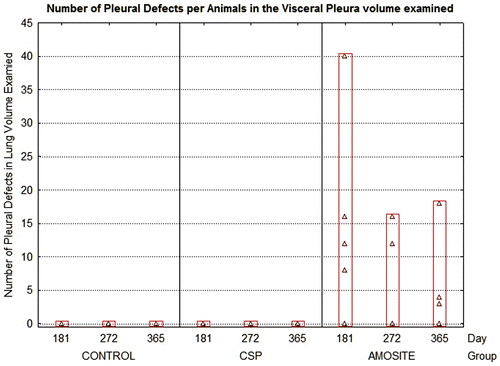
Figure 11.  The average number of pleural defects per field of view (average field of view was 0.0075 mm2) is shown for the air control, CSP, and amosite asbestos-exposed groups.

Figure 12.  The number and length of fibers present at the visceral surface are shown.

Figure 12.  The number and length of fibers present at the visceral surface are shown.

Figure 13.  View of the pleural space at 181 days postexposure from a control animal is shown in the confocal image. The subpleural alveolar septa is seen on the left with the parietal pleura shown on the right. The brighter white is indicative of collagen in the visceral and parietal pleural walls. Free macrophages are present within the pleural space (bottom middle).
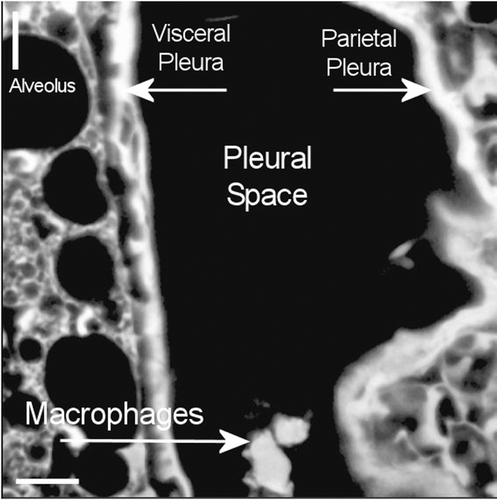
Figure 13.  View of the pleural space at 181 days postexposure from a control animal is shown in the confocal image. The subpleural alveolar septa is seen on the left with the parietal pleura shown on the right. The brighter white is indicative of collagen in the visceral and parietal pleural walls. Free macrophages are present within the pleural space (bottom middle).

Figure 14.  View of the pleural space at 272 days postexposure from a control animal is shown in the confocal image. The subpleural alveolar septa is seen on the left with the parietal pleura shown on the right. The brighter white is indicative of collagen in the visceral and parietal pleural walls.
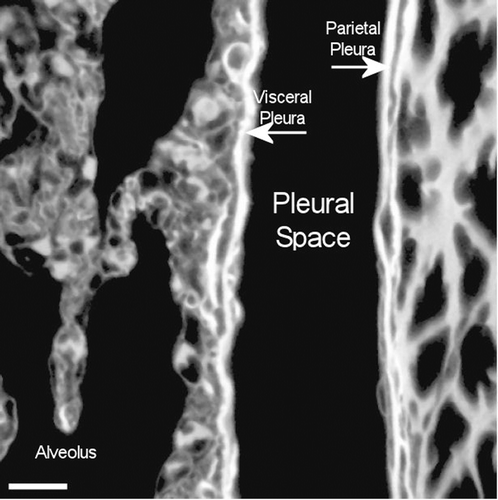
Figure 14.  View of the pleural space at 272 days postexposure from a control animal is shown in the confocal image. The subpleural alveolar septa is seen on the left with the parietal pleura shown on the right. The brighter white is indicative of collagen in the visceral and parietal pleural walls.

Figure 15.  View of the pleural space from an animal exposed to CSP mixture at 272 days postexposure is shown in the confocal image. This confocal micrograph is very similar to that seen for the air control ().
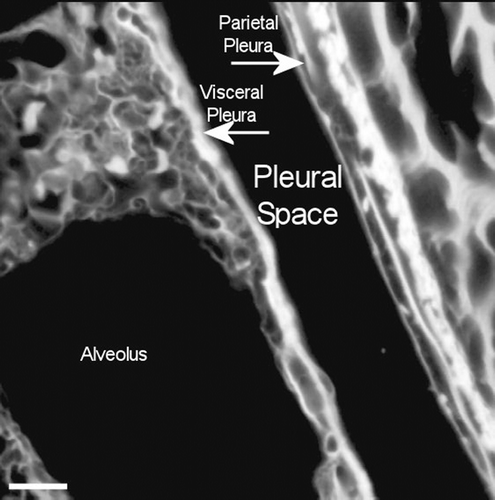
Figure 15.  View of the pleural space from an animal exposed to CSP mixture at 272 days postexposure is shown in the confocal image. This confocal micrograph is very similar to that seen for the air control (Figure 14).

Figure 16.  View of the pleural space from an animal exposed to amosite asbestos at 181 days postexposure. Amosite fibers are seen in a subpleural granuloma with numerous alveolar macrophages in the subpleural alveoli.
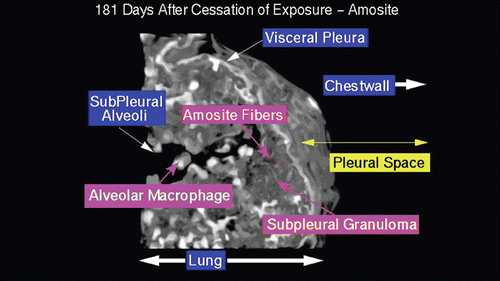
Figure 16.  View of the pleural space from an animal exposed to amosite asbestos at 181 days postexposure. Amosite fibers are seen in a subpleural granuloma with numerous alveolar macrophages in the subpleural alveoli.

Figure 17.  View of the pleural space from an animal exposed to amosite asbestos at 272 days postexposure. An amosite fiber ~ 39 µm in length is observed within a subpleural granuloma. The right edge of this long fiber pierces the subpleural capsule. The thicker bright white matrix is indicative of a fibrotic thickening of the visceral pleura.
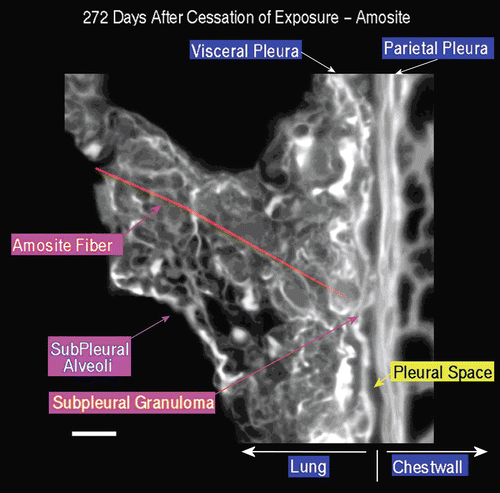
Figure 17.  View of the pleural space from an animal exposed to amosite asbestos at 272 days postexposure. An amosite fiber ~ 39 µm in length is observed within a subpleural granuloma. The right edge of this long fiber pierces the subpleural capsule. The thicker bright white matrix is indicative of a fibrotic thickening of the visceral pleura.

Figure 18.  View of the pleural space from an animal exposed to amosite asbestos at 272 days postexposure. The subpleural alveolar septa seen in the left center of the image contains fibrotic lesions (thicker bright white matrix is indicative of enhanced collagen deposition). The parietal pleura and chest wall is shown on the right. Within the alveolus on the left, a number of subpleural macrophages can be seen.
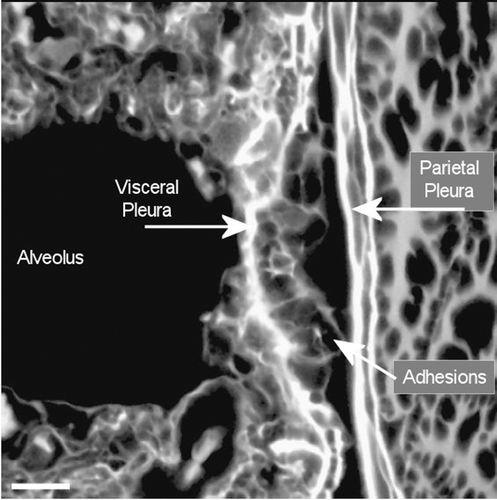
Figure 18.  View of the pleural space from an animal exposed to amosite asbestos at 272 days postexposure. The subpleural alveolar septa seen in the left center of the image contains fibrotic lesions (thicker bright white matrix is indicative of enhanced collagen deposition). The parietal pleura and chest wall is shown on the right. Within the alveolus on the left, a number of subpleural macrophages can be seen.
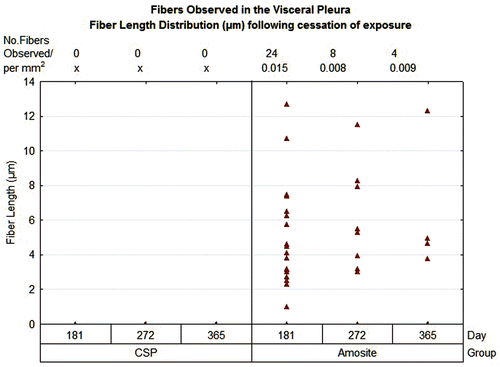
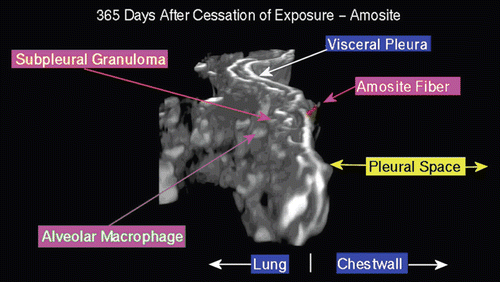
Figure 19.  View of the pleural space from an animal exposed to amosite asbestos at 365 days postexposure. An amosite fiber penetrating the visceral pleural wall into the pleural space is seen. On the lung side, a well-developed subpleural granuloma is seen with alveolar macrophages on the surface.

Figure 19.  View of the pleural space from an animal exposed to amosite asbestos at 365 days postexposure. An amosite fiber penetrating the visceral pleural wall into the pleural space is seen. On the lung side, a well-developed subpleural granuloma is seen with alveolar macrophages on the surface.