Figures & data
Figure 1. Protocols used to test for respiratory sensitization/allergy in a topical-induction and repeated inhalation priming/elicitation Brown Norway rat model. Two weeks after the last sensitization encounter, the rats were subjected to a dose–escalation type (Cconst × tvar) of bronchoprovocation challenge at 110 mg HDI/m3 for either 6, 13, 35, or 50 min duration (step I). At step II, similar sensitized rats were subjected to three successive inhalation priming/challenge exposures at about 120–87–72 mg/m3 × 30 min () followed by bronchoprovocation challenge at about 72 mg/m3 for either 6, 13, 35, or 75 min duration. The time periods between priming inhalation challenges was selected that irritant inflammation regresses from one interval to the next whereas the allergic-type inflammation progresses. The asthma phenotype was probed by lung function measurements overnight post-challenge and PMN in bronchoalveolar lavage fluid (BAL) 1 d after the respective escalation inhalation challenge. Nitric oxide in exhaled air was analyzed before and after lung function measurements.
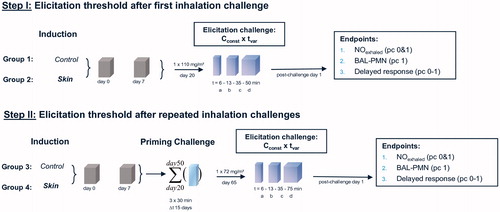
Figure 2. Analytically determined concentrations of HDI in naïve control (groups 1 and 3) and sensitized rats (groups 2 and 4) at the durations of bronchoprovocation of “a–d” ().
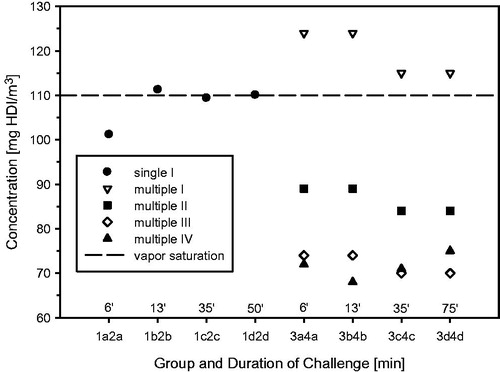
Figure 3. Concentration dependence of HDI-aerosol relative to the total concentration of HDI.
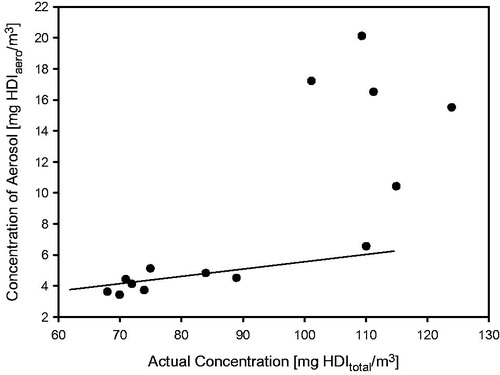
Figure 4. Ancillary pre-study showing the time and concentration dependence of respiratory changes in naïve Wistar rats (5–6 animals/concentration) that were simultaneously exposed for 15-min to air, 30-min to either HDI-vapor (up to 27 mg/m3) or aerosol (at and above 109 mg/m3) followed by a 30-min recovery period. Changes in tidal volumes, minute volumes (MV), and the concentration dependence of ventilation (MV) are given in the top, middle, and lower panels, respectively. Measurements were made in head-out volume–displacement plethysmographs attached to a directed-flow nose-only inhalation chamber (Pauluhn & Thiel, Citation2007). The solid lines were derived using a sigmoid model fitted to measurements from the pre-exposure and exposure periods to estimate the degree of respiratory depression. All data were normalized to the pre-exposure period (=100%). The concentration dependence of the maximum stable depression of the respiratory minute volume is depicted in the lower panel. Depressed tidal volumes increased at concentrations with stable aerosol ().
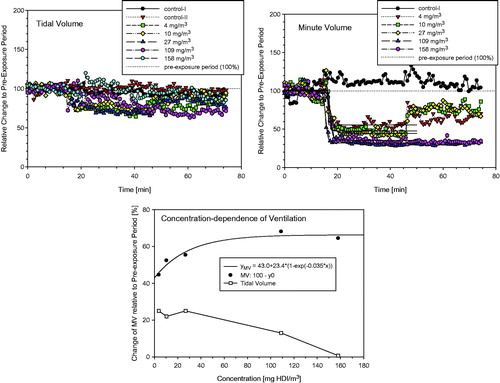
Figure 5. Concentration- and time-related changes of endpoints in bronchoalveolar lavage fluid (BAL) indicative of acute alveolar irritation 1-h, 1 and 3 d postexposure of Wistar rats exposed to HDI-vapor/aerosol at 112 and 190 mg HDI/m3 for 30 min. Absolute numbers of cytodifferentiated cells from BAL were from postexposure day 1. Analyses from day 0 and 3 revealed less pronounced changes. Data were presented as means ± SD (six rats/group). Asterisks denote significant difference to the equally exposed air time-matched control group (*p < 0.05, **p < 0.01).
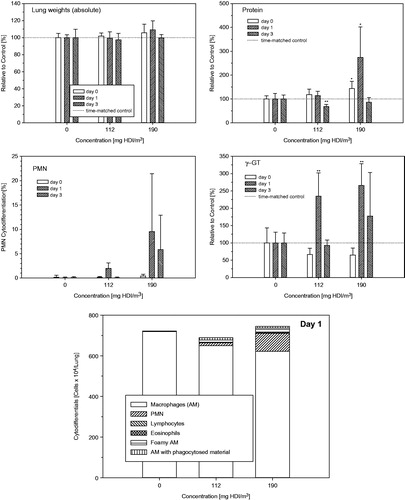
Figure 6. Inhalation exposure of Brown Norway rats to 100 or 200 mg/m3 polyisocyanate aerosol for 30-min with and without supplementation of 8 mg HDI/m3. Respiratory function measurements were made concomitant with exposure (15-min exposure to air for the collection of base-line data, 30 min exposure to the diisocyanate followed by air exposure for 30 min). Rats were subjected to bronchoalveolar lavage fluid (BAL) on postexposure day 1. Data were presented as means ± SD (six rats/group). Asterisks denote significant difference to the equally exposed air time-matched control group (*p < 0.05, **p < 0.01).
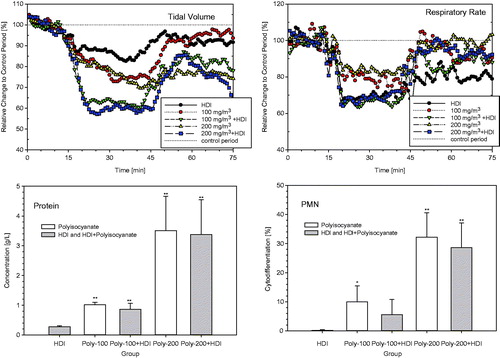
Figure 7. Measurement of Penh (enhanced pause) in whole body barometric plethysmographs after escalation challenge I – step I (see ) in naïve but challenged (vehicle/HDI) and skin-sensitized and challenged (HDI/HDI) Brown Norway rats. Data represent records from individual rats (four rats/subgroup) after challenge over a duration of approximately 20 h (Penh-AUC20 h). Note: Due to the limited number of plethysmographs available, only four out of eight rats/subgroup were examined to allow the simultaneous measurement of four naïve and four sensitized rats.
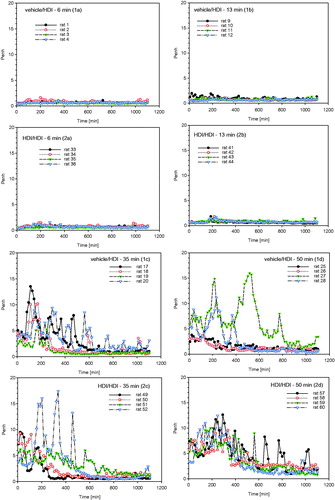
Figure 8. Measurement of Penh (enhanced pause) in whole body barometric plethysmographs after escalation challenge IV – step II (see ) in naïve but challenged (vehicle/HDI) and skin-sensitized and challenged (HDI/HDI) Brown Norway rats. Data represent records from individual rats (four rats/subgroup, for more details, see legend of ) after challenge over a duration of approximately 20 h (Penh-AUC20 h).
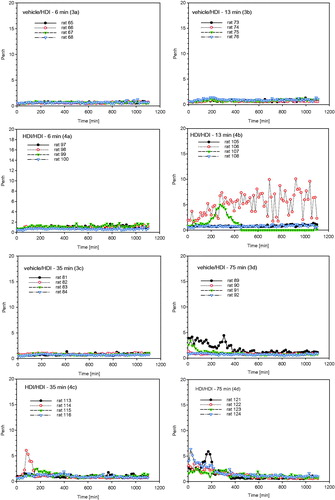
Figure 9. Protein and PMN in bronchoalveolar lavage at escalation challenges I (step I) and IV (step II) (for details, see ). The inhalation Cconst used at steps I and II were 110 and 70 mg/m3, respectively, at somewhat similar tvar, as shown in . The higher responsiveness observed at step I is attributed to the higher Cconst close to the vapor saturation concentration of HDI. Data were presented as means ± SD (eight animals/subgroup). Significant differences to the similarly challenged naïve control groups did not occur (p > 0.05).
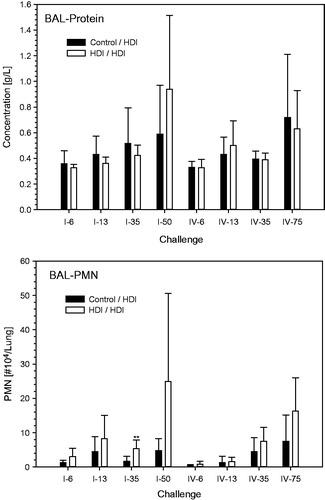
Figure 10. Absolute cytodifferentiation of cells in bronchoalveolar lavage at escalation challenges I (step I) and IV (step II) (for details, see ).
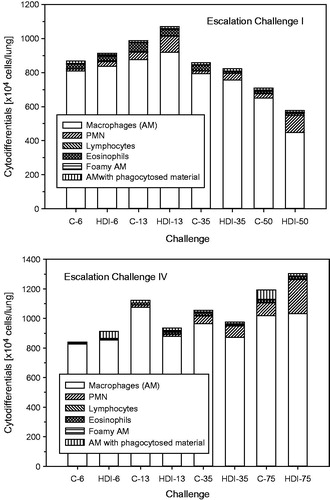
Figure 11. Nitric oxide (NO) in exhaled breath at escalation challenges I (step I) and IV (step II) (for details, see ). Data were presented as means ± SD (eight animals/subgroup). Asterisks denote a difference of p < 0.01.
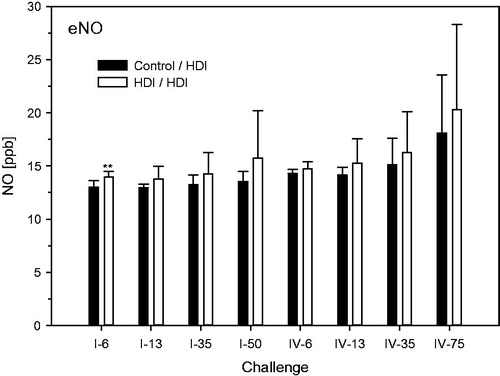
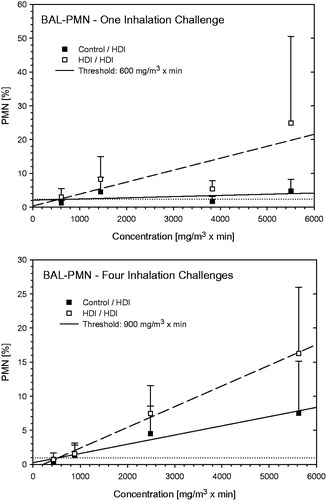
Figure 12. Dependence of PMN in bronchoalveolar lavage on the escalation C × t-dose of HDI at escalation challenges I (step I) and IV (step II) (for details, see ). Data were presented as means ± SD (eight animals/subgroup). Equally challenged naïve and HDI-sensitized Brown Norway rats were considered indistinguishable at 600 and 900 mg HDI/m3 × min in rats without and with additional inhalation priming exposures.