Figures & data
FIGURE 1. Photographs of the right eye at the initial visit (a–c) and 7 months after systemic prednisolone therapy (d–f) in a patient with serpiginous choroiditis. (a) Panorama fundus photograph showing yellow choroiditis plaques with a serpiginous distribution outward from the optic disc. (b) Fluorescein angiography of the venous phase showing initial faint hypofluorescent patches with ill-defined margin within the choroiditis plaques. (c) Indocyanine green angiography (ICGA) of the initial phase showing hypofluorescence corresponding to the plaques. (d) Choroiditis plaques developed serpiginous-shaped scar lesions sparing the macula. (e) Fluorescein angiography revealed hyperfluorescence corresponding to the scar lesions (d). (f) On ICGA, the hypofluorescent areas decreased compared to those at the initial visit (c).
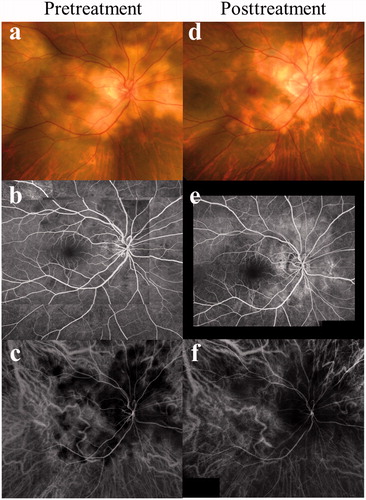
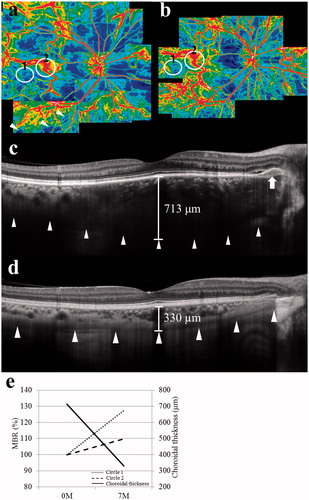
FIGURE 2. Laser speckle flowgraphy (LSFG) (a, b) and enhanced-depth imaging optical coherence tomography (EDI-OCT) (c, d) findings at pretreatment (a, c) and 7 months after treatment (b, d). (a) Panorama color map of LSFG showing decreased mean blur rate (MBR) over a wider area (arrowheads) than the hypofluorescent area observed on ICGA (). Blue and red indicate decreased and increased MBR, respectively. (b) The area of decreased MBR diminished in the posterior pole compared to that of the initial visit (a). (c) Horizontal EDI-OCT through the fovea showing markedly increased choroidal thickness and a hyperreflective lesion at subretinal pigment epithelium level (arrow) with shallow serous retinal detachment corresponding to the peripapillary choroiditis plaques. (d) Central choroidal thickness dramatically decreased with resolution of pigment epithelial detachment. (e) The graph shows the changes in the average MBR and subfoveal choroidal thickness during systemic corticosteroid therapy. The average MBR showed 27.4% increase in a lesion site (circle 1 shown in ) and 9.7% increase in a normal-appearing retinal site (circle 2 shown in ) at 7 months after treatment, compared to the pretreatment level (100%). Subfoveal choroidal thickness decreased from 713 µm to 330 µm.