Figures & data
FIGURE 1 Overview of a current standard apparatus for three-rods test in Japan (A), three black rods inside the uniformly illuminated box with white inner walls (B) and a small viewing window on the black outer frontal wall (C). An examinee sits on a chair, 2.5 m apart from the fixed rods inside the illuminated box, and observes the central moving rod through the viewing window of 44 mm vertical length and 104 mm horizontal length. The fixed rods are located inside the box at the distance of 262 mm from the outer wall of the viewing window. At the distance of 2.5 m, an examinee sees only the three rods in the background of white illumination inside the box. Note that the illuminators in the box can be observed on plate C because photographic viewing distance is too near.
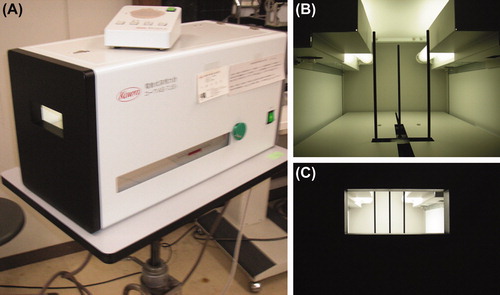
FIGURE 2 Mean erred distance in 4 measurements by three-rods test and stereoacuity measured at 3 m by Distance Randot Stereotest. Significant positive correlation is noted between the erred distance and the distant stereoacuity (ρ = 0.418, p = 0.0023, Spearman rank correlation test).
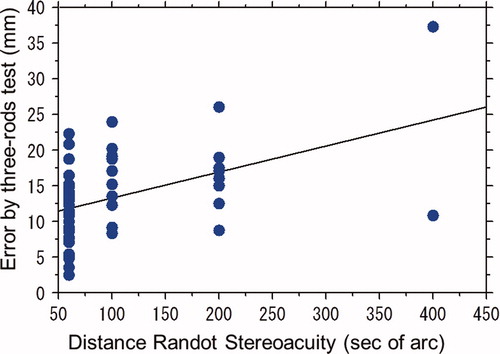
FIGURE 3 Mean erred distance in 4 measurements by three-rods test and stereoacuity measured at 40 cm by TNO Stereotest. Positive correlation, although not significant, is noted between the erred distance and the near stereoacuity (ρ = 0.239, p = 0.0824, Spearman rank correlation test).
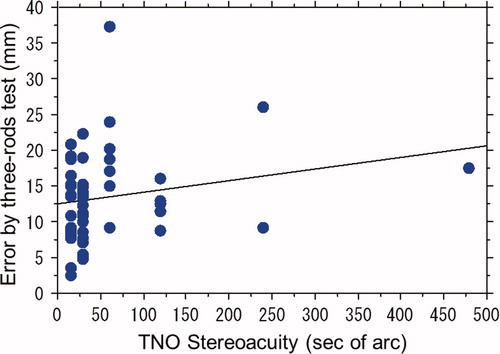
FIGURE 4 Mean erred distance in 4 measurements by three-rods test and stereoacuity measured at 40 cm by Titmus Stereotest. Significant positive correlation is noted between the erred distance and the near stereoacuity (ρ = 0.311, p = 0.0234, Spearman rank correlation test).
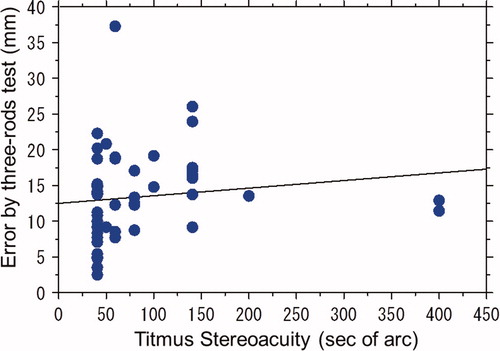
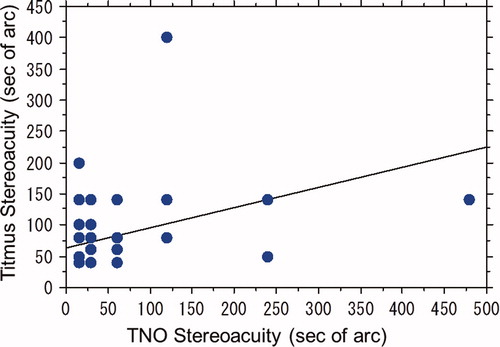
FIGURE 5 Stereoacuity measured at 40 cm by TNO Stereotest and Titmus Stereotest. Significant positive correlation is noted between the near stereoacuity measured by the two tests (ρ = 0.431, p = 0.0017, Spearman rank correlation test).