Figures & data
Table 1. Prevalence (%) of overweight and obesity in school-age children based on available data and IOTF criteria, and estimated for 2006 and 2010.
Table 2. Combined childhood overweight and obesity prevalence (%) based on data collected since around the year 2000 for selected countries by WHO region.a
Table 3. Time trends in the combined prevalence (%) of overweight and obesity in preschool-age children aged 0–5 years for the years from 1990 to 2010 and projections for 2015 and 2020, by United Nations (UN) region.a
Figure 1. (A) Worldwide prevalence of obesity in children and adolescents. (B) Worldwide combined prevalence of overweight and obesity in children and adolescents. The prevalence estimates were calculated as the arithmetic mean of the age-specific estimates. Adapted from Epidemiology of Obesity in Children and Adolescents (Pigeot et al., 2011, p. 228, Figure 13.2) with kind permission of Springer Science & Business Media.
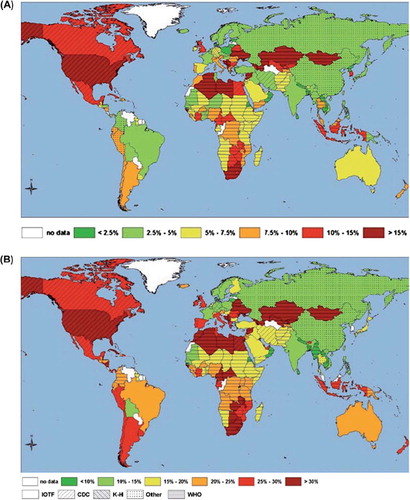
Figure 2. Trends in the prevalence (%) of obesity (BMI ≥ 95th percentile) in US children and adolescents by age: 1971–1974 to 2009–2010. Based on national data collected in NHANES (CitationWang and Beydoun, 2007; CitationOgden et al., 2012).
Figure 3. Yearly average change in BMI (kg/m2), waist circumference (WC) (cm) and triceps skinfold thickness (TST) (mm) by their percentile distributions in US adolescents: 1988–1994 to 1999–2004. OLS estimate of average yearly shift within percentile groups based on NHANES III (1988–1994) and 1999–2004 data. Adapted from CitationBeydoun & Wang (2010).
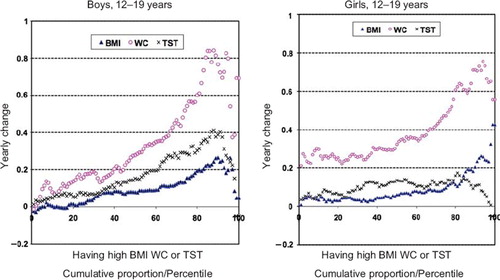
Figure 4. Trends in the prevalence (%) of overweight and obesity in Chinese school-age children, by gender: 1985–2005. Based on Chinese BMI cut-off points and data reported by Ji & Cheng (2008).
Figure 5. Association between family affluence and obesity in adolescent boys aged 11, 13 and 15 years from five countries: Example of overweight inequality regression lines. Data were collected from the Health Behavior in School-Aged Children study. Family affluence was measured as a function of family possessions (e.g. car ownership, number of computers, child had own bedroom) and number of family travels over the past year. Adapted by permission of Macmillan Publishers Ltd, International Journal of Obesity (CitationDue et al., 2009, p. 1088, ).
Figure 6. Time trends in disparities of overweight prevalence by socio-economic status (SES) in US children and adolescents: 1971–1975 to 1999–2002. Obesity was defined as a BMI ≥ 95th percentile. The sample size in each National Health and Nutrition Examination Survey (NHANES) was: NHANES I (n = 6555), NHANES II (n = 6741), NHANES III (n = 9731), and NHANES 1999–2002 (n = 7390). Adapted by permission of the American Society for Nutrition from the American Journal of Clinical Nutrition (Youfa Wang & Qi Zhang, 2006, p. 709, ). *Significant between-group differences, P < 0.05 (chi-square tests).