Figures & data
Figure 1. A side population (SP cells) was isolated from the A431 carcinoma cell line. SP cells representing 1.6% (n = 20) of total cells were isolated from the A431 carcinoma cells using the Hoechst 33342 dye efflux method (A). An inhibitor of Hoechst efflux (verapamil, 250 μM) was used to check specificity of the SP phenotype (B). SP, side population; MP, main population.
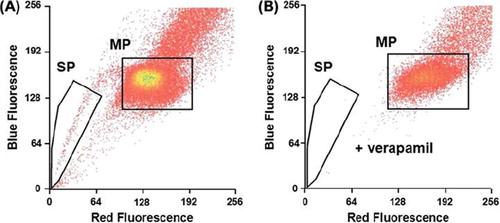
Figure 2. Fast repair of radiation-induced DNA damage in SP cells. Following gamma irradiation (4 Gy), SP cells exhibited a faster repair of DNA damage than MP cells as measured by the alkaline comet assay. The level of damage in non-irradiated cells (dotted line) was similar for both cell populations. Data are the mean values + / − SEM (standard error of the mean) of three independent experiments. Asterisks indicate a significant difference (p < 0.05). SP, side population; MP, main population.
Figure 3. The FGF2 pathway regulates DNA repair. Addition of UO126 inhibitor (5 μg/ml) 30 min before radiation exposure slowed down DNA repair in SP cells (A), whereas DNA repair remained unaltered in MP cells (B). Addition of exogenous FGF2 (10 and 50 ng/ml) 1 h before radiation exposure accelerated DNA repair only in MP cells (C and D, alkaline comet assay at 10 min). Data are the mean values + / − SEM (standard error of the mean) of three independent experiments. Asterisk indicates a significant difference (p < 0.05). SP, side population; MP, main population.
Figure 4. High constitutive intracellular FGF2 in SP cells. Immediately after cell sorting, quantification of nuclear and cytoplasmic contents of FGF2 protein by ELISA showed that SP cells contained more nuclear FGF2 than MP cells (A). After overnight culture, FGF2 mRNA was 4-fold higher in SP cells than in MP cells (B) and the total intracellular content of FGF2 protein was higher in SP than in MP cells (C). Data are the mean + / − SEM (standard error of the mean) of three (A and B) or four (C) independent experiments. Asterisks indicate a significant difference (p < 0.05). SP, side population; MP, main population.
Figure 5. γ-rays induce FGF2 secretion by SP cells. Intracellular and secreted FGF2 were quantified by ELISA. After a culture period of 48 h, the total intracellular content of FGF2 protein remained higher in SP than in MP cells and was not altered after 2 Gy in both cell populations (A). Only SP cells secreted FGF2 in cell culture medium 48 h after irradiation with 2 Gy (B). Data are the mean values + / − SEM (standard error of the mean) of three (A) or five (B) independent experiments. Asterisk indicates a significant difference (p < 0.05). SP, side population; MP, main population.