Figures & data
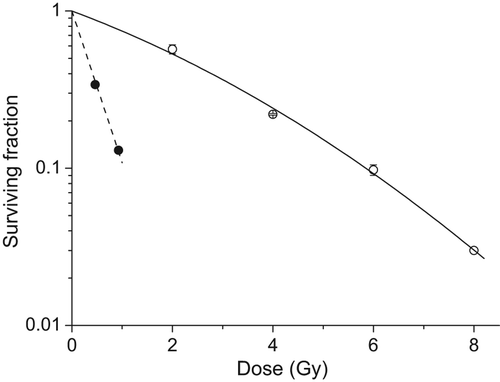
Figure 1. Survival curve for NHBE cells following exposure to high-LET α-particles (circle) and 60Co γ-rays (square; error bars represent standard deviation, n = 3). The variation in surviving fraction, S, as a function of dose, D, was fitted to equation S = exp(−αD − βD2) where α = 2.22 ± 0.02 and β = 0 for alpha-particles and α = 0.27 ± 0.03 and β = 0.021 ± 0.004 for γ-rays.

Table I. Frequency of chromosomal damage induced in NHBE cells after exposure to γ-rays.
Table II. Frequency and sub-classification of PCC breaks.
Table III. Frequency of chromosomal damage induced in NHBE cells after exposure to ˜ 1 α-particle/nucleus.
Table IV. Minimum number of chromosomes and breaks in each complex exchange.
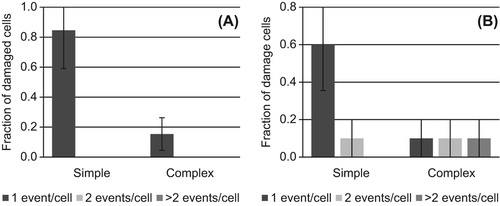
Figure 2. Distribution of chromosomal exchanges in aberrant spreads observed 24 hours after exposure to (A) 0.5 or (B) 1.0 Gy γ-rays. The fraction of damaged cells that contain 1 (dark), 2 (light) or > 2 (medium) simple exchanges (simple) or simple + complex exchanges (complex) are shown. Error bars represent standard deviation.

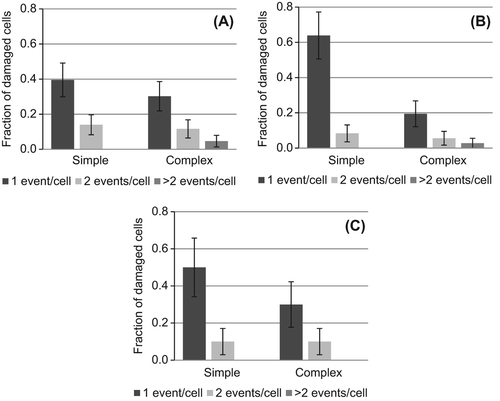
Figure 3. Distribution of chromosomal exchanges in aberrant spreads observed (A) 24, (B) 29 and (C) 34 hours after exposure to ˜ 1 high-LET α-particle/nucleus. The fraction of damaged cells that contain 1 (dark), 2 (light) or > 2 (medium) simple exchanges (simple) or simple + complex exchanges (complex) are shown. Error bars represent standard deviation.

Table V. Simple and complex exchanges classified as transmissible.
