Figures & data
Table 1. Demographic and clinical characteristics of study participants.
Figure 1. Adhesive activity and heart rate monitoring patch used in the study (Proteus Digital Health, Redwood City, CA).
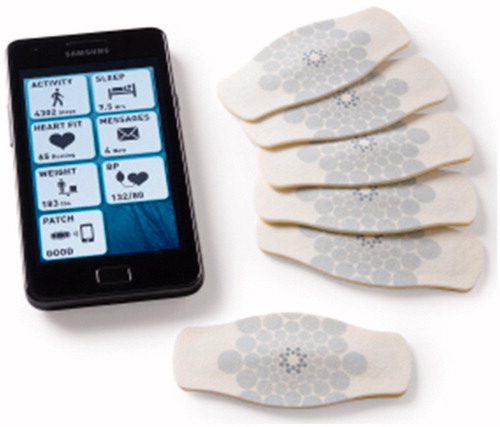
Figure 2. First five values of multiscale entropy of heart rate (left) and locomotor activity (right) signals of schizophrenia patients and normal controls. Solid lines represent fitting a third-degree polynomial in a least squares sense into the first five MSE scales, with coefficients presented in .
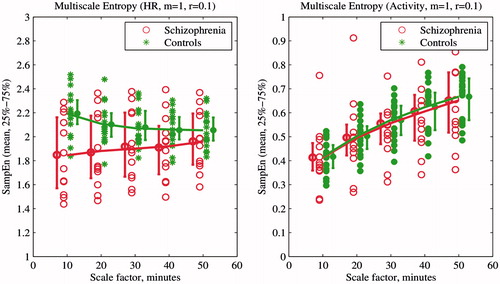
Figure 3. First five values of transfer entropy of heart rate (HR) and activity signals of schizophrenia patients and normal controls. Transfer Entropy from HR to locomotor activity is on the left and from locomotor activity to HR on the right. Solid lines represent the fitting of a third-degree polynomial in a least squares sense into the first five TE values. Resultant coefficients are presented in .
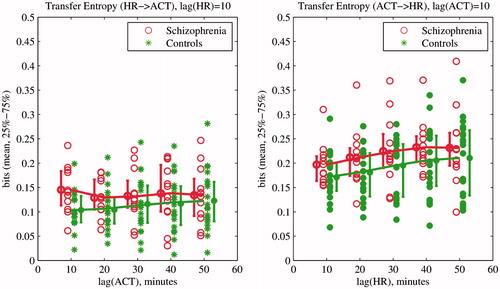
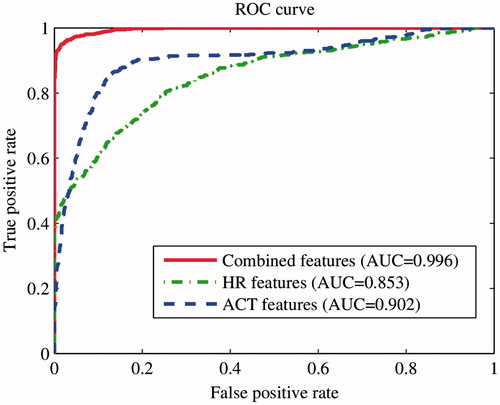
Figure 4. ROC curves and AUC for evaluated models based on locomotor activity only (ACT features; dashed line), heart rate only (HR features; dot-dashed line) and combined HR and activity features (solid line). The AUC values are significantly different between models at a 1% significance level according to two-sided Wilcoxon rank sum test with the Bonferroni correction for multiple comparisons.