1,224
Views
31
CrossRef citations to date
0
Altmetric
Research Papers

Correlation between single limb support phase and self-evaluation questionnaires in knee osteoarthritis populations

, , , , , , , & show all
Pages 1103-1109 | Accepted 01 Aug 2010, Published online: 23 Sep 2011

Figures & data

Table I. Baseline patient characteristics (n  ==  125).

Table II. Spatio-temporal parameters measured by gait analysis.

Table III. WOMAC osteoarthritis index and SF-36 health survey scores.

Table IV. Correlation between the WOMAC-pain, WOMAC-function, SF-36 sub-categories, normalised velocity, normalised step length parameters and both K&L scale and SLS.

Table V. Distribution of mean SLS values over WOMAC-pain quartiles.

Table VI. Distribution of mean SLS values over WOMAC-function quartiles.

Table VII. Distribution of mean SLS values over SF-36 overall score quartiles.

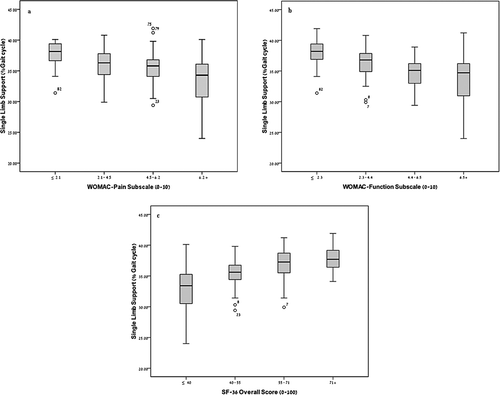
Figure 1.  Single limb support distribution according to (a) WOMAC-pain, (b) WOMAC function and (c) SF-36 overall score quartiles. The box plots represent the median value of SLS with the range of the 1st quartile and the 3rd quartile.

Figure 1.  Single limb support distribution according to (a) WOMAC-pain, (b) WOMAC function and (c) SF-36 overall score quartiles. The box plots represent the median value of SLS with the range of the 1st quartile and the 3rd quartile.