Figures & data
Table 1. Demographics of the study populations for Parts 1 and 2.
Table 2. NIS score ranges, item-total correlations and loadings on first two principal components using Varimax rotation.
Table 3. Inter-rater agreement: item-by-item linear-weighted kappa coefficients interpreted according to Landis and Koch [Citation19].
Figure 1. Box and whisker plots for total NIS scores at admission and discharge. shows a box and whiskers plot of the total NIS scores as rated by the MD and medical teams on admission and the MD team at discharge. There was no significant difference between the two admission ratings (mean difference 0.03, 95% CI −1.16–1.11, t = 0.045, p = 0.96). However, there was a significant reduction in team-rated total scores between admission and discharge (see ).
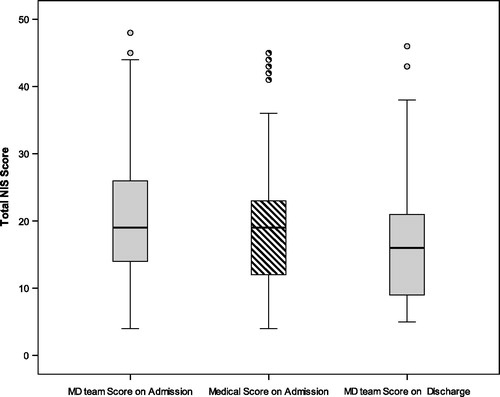
Table 4. Descriptive statistics for NIS and UK FIM + FAM scores as rated by the MD Team on admission and discharge (n = 73).
Table 5. Pearson correlations for admission and change scores (n = 73).
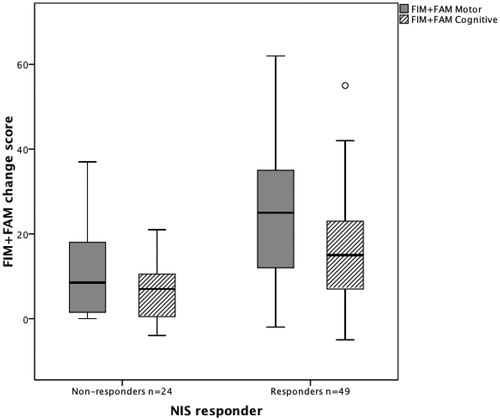
Figure 2. Box and whisker plots for change in total FIM + FAM domain scores between admission and discharge in the impairment “responder” and “non-responder” groups. shows box and whiskers plots of the FIM + FAM change scores, in patients who did and did not demonstrate change in the NIS score during their rehabilitation programme. Both groups improved overall, but impairment “responders” made significantly greater gains in both motor and cognitive function than the “non-responders”.