Figures & data
Table 1. Participant tweet data.
Figure 1. P1 Gephi visualisation. Key: P1 = participant 1 node; P1U = undirected tweets from the participant's handle to all followers (not mentioning any other profiles).
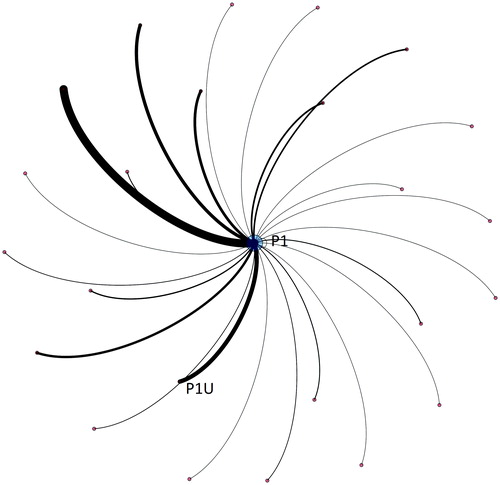
Figure 2. P2 Gephi visualisation. Key: P2 = participant 2 node; P2U = undirected tweets from the participant's handle to all followers (not mentioning any other profiles).
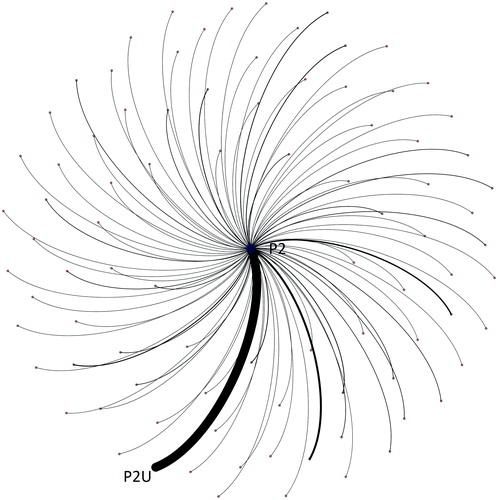
Figure 3. P2 Gephi visualisation. Key: P3 = participant 3 node; P3U = undirected tweets from the participant's handle to all followers (not mentioning any other profiles).
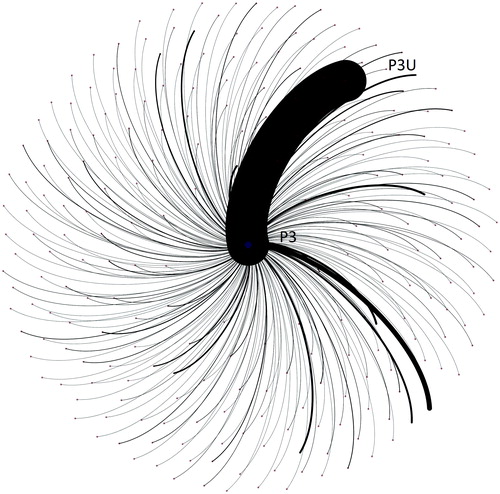
Figure 4. P4 Gephi visualisation. Key: P4 = participant 4 node; P4U = undirected tweets from the participant's handle to all followers (not mentioning any other profiles).
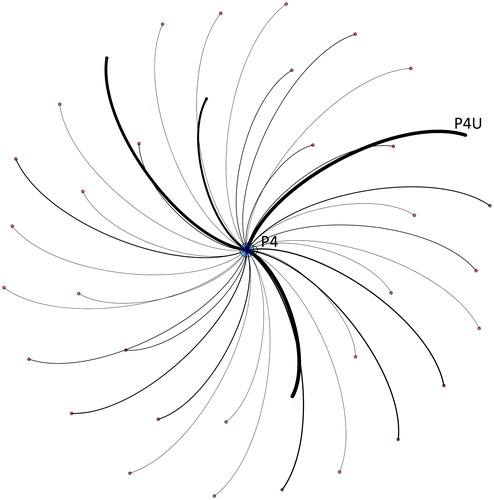
Figure 5. All participants Gephi visualisation. Key: P1 = participant 1; P2 = participant 2; P3 = participant 3; P4 = participant 4; P5 = participant 5.
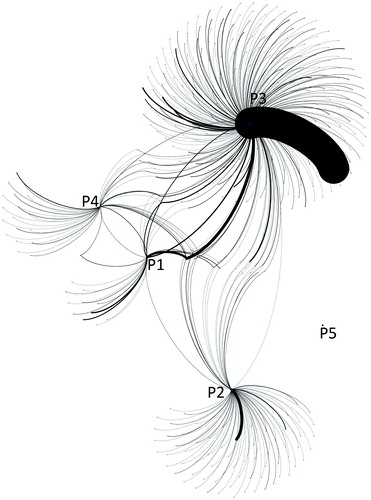
Figure 6. Individual participant's micro-, meso- and macro-layers of tweets. Key: P1 = participant 1; P2 = participant 2; P3 = participant 3; P4 = participant 4; P5 = participant 5. Note: Percentages are of the individual's total tweets, so that each individual adds up to 100% and categories are mutually exclusive.
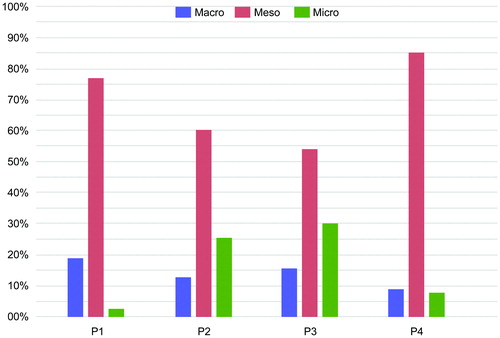
Table 2. Structural layers of tweets in the sample: macro-, meso- and micro-layers.
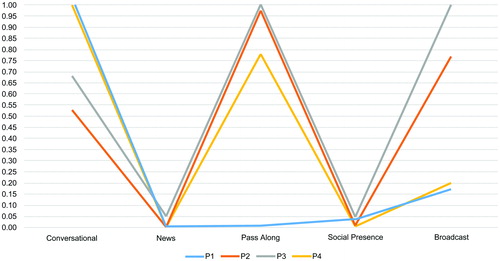
Figure 7. Individual participant percentage of content of tweets. Key: P1 = participant 1; P2 = participant 2; P3 = participant 3; P4 = participant 4; P5 = participant 5. Note: Percentages are of the individual's total tweets, so that each individual adds up to 100% and categories are mutually exclusive.
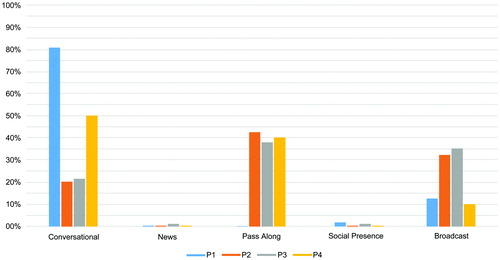
Table 3. Group results of tweets by content.
Figure 8. Normalized results of tweet content for four active users. Key: P1 = participant 1; P2 = participant 2; P3 = participant 3; P4 = participant 4; P5 = participant 5.