Figures & data
Table I. Oligonucleotides used for the constructs of this study.
Figure 1. ER localization of the NS4B-GFP chimera in the Huh7 cells. Huh7 cells transiently transfected with the pEGFP-NS4B plasmid were fixed and mounted directly on glass slides (a and c) or fixed and stained with the anti-NS4B-N (1.3 μg/ml) affinity purified pAb followed by incubation with the goat anti-rabbit Alexa546 secondary pAb (b). Treatment with cycloheximide (c) was performed 24 h p.t (50 μg/ml, 5 h at 37°C). Representative confocal images are shown in black and white. The details (insets) represent 2× magnifications of the framed areas. (a) and (c): GFP auto fluorescence; (b): indirect immunofluorescence labelling with the anti-NS4B-N pAb.
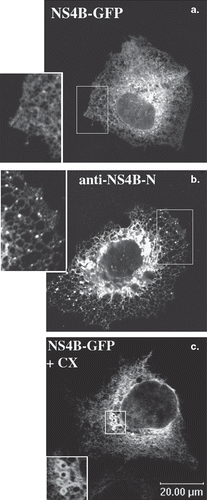
Figure 2. (A) Schematic representation of the NS4B TM topology and the NS4B-GFP chimeras used. The TM NS4B topology model shown at the top is based on the TMHMM trasmembrane prediction method (Supplementary Table S1, online version only). As residue 1 is considered the Ser residue 1712 of the HCV 1aH77 polyprotein (GenBank, accession no. AF009606.1 [Citation34]). White boxes: NS4B sequence; Dark grey boxes: GFP sequence. Dark grey vertical bars: the position of the putative NS4B TM helices. Broken lines: deleted NS4B sequences. Black boxes: the linker arms of 11 (pEGFP-N3) or 12 (pEGFP-C2) residues between the NS4B and GFP sequences. Numbering of the NS4B residues included in the chimeras is given at the beginning and end of the white boxes. The molecular size of the chimeras is indicated on the right. (B) A helical wheel plot of the predicted amphipathic helix between NS4B residues 45-62. The indicated sequence was analysed by the Helical Wheel Custom Images and the Interactive Java Applet (http://kael.net/helical.htm). (C) Sequence alignment of the NS4B LRRs like motif from different HCV isolates. A CLUSTALW multiple sequence alignment was performed for NS4B sequences from representative subtypes of all six major HCV genotypes. The genotypic origin and the subtype of each sequence is indicated on the left. Names of isolates, accession numbers and sequence references in PUBMED are presented in Supplementary Table S2; online version only. The consensus sequence is shown beneath the alignment. Numbering of the sequence presented, and the region including the LRRs are shown at the top. For graphic representation of the aligned sequences the ESPript.2.2 software (http://espript.ibcp.fr/ESPript/ESPript/) was used.
![Figure 2. (A) Schematic representation of the NS4B TM topology and the NS4B-GFP chimeras used. The TM NS4B topology model shown at the top is based on the TMHMM trasmembrane prediction method (Supplementary Table S1, online version only). As residue 1 is considered the Ser residue 1712 of the HCV 1aH77 polyprotein (GenBank, accession no. AF009606.1 [Citation34]). White boxes: NS4B sequence; Dark grey boxes: GFP sequence. Dark grey vertical bars: the position of the putative NS4B TM helices. Broken lines: deleted NS4B sequences. Black boxes: the linker arms of 11 (pEGFP-N3) or 12 (pEGFP-C2) residues between the NS4B and GFP sequences. Numbering of the NS4B residues included in the chimeras is given at the beginning and end of the white boxes. The molecular size of the chimeras is indicated on the right. (B) A helical wheel plot of the predicted amphipathic helix between NS4B residues 45-62. The indicated sequence was analysed by the Helical Wheel Custom Images and the Interactive Java Applet (http://kael.net/helical.htm). (C) Sequence alignment of the NS4B LRRs like motif from different HCV isolates. A CLUSTALW multiple sequence alignment was performed for NS4B sequences from representative subtypes of all six major HCV genotypes. The genotypic origin and the subtype of each sequence is indicated on the left. Names of isolates, accession numbers and sequence references in PUBMED are presented in Supplementary Table S2; online version only. The consensus sequence is shown beneath the alignment. Numbering of the sequence presented, and the region including the LRRs are shown at the top. For graphic representation of the aligned sequences the ESPript.2.2 software (http://espript.ibcp.fr/ESPript/ESPript/) was used.](/cms/asset/4295485c-17c8-4ed3-a94c-205f9a639031/imbc_a_442821_f0002_b.gif)
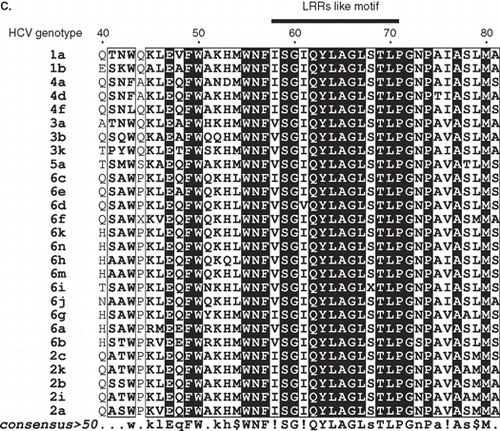
Figure 3. Predominant localization of the GFP chimeric NS4B mutants in Huh7 cells. Huh7 cells expressing the GFP NS4B chimeric deletions were visualized 24–48 h p.t.either by indirect immunofluorescence (left panels) using the anti-NS4B-N (2.6 μg/ml) (a, c, e, g, j); or the anti-GFP pAbs (4.5 μg/ml) (k, m) and the goat anti-rabbit Alexa546 pAb or by GFP auto fluorescence (right panels). Representative confocal microscopy images are shown in black and white.
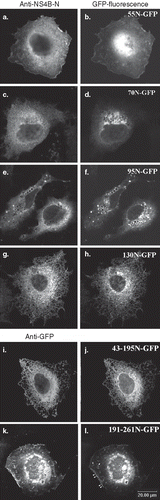
Figure 4. Colocalization of the GFP chimeric NS4B mutants with intracellular markers. Huh7 cells expressing the 70N, 95N or 161-261N GFP chimeras were fixed and mounted directly on coverslips or stained for Golgi with the anti-GTL2 mAb (10 μg/ml), for NS4B with the anti-NS4B-N (2.6 ng/ml), or for ER with the anti-calnexin pAb followed by the anti-mouse Alexa546 or the anti-rabbit Alexa546 pAbs respectively. Mitochondria were labeled by incubation with the MitoTracker Orange CMTMRs (30 min, 37°C, 50 ng/ml). Representative confocal microscopy images are shown in black and white. Details at the bottom represent 2× magnifications of the framed areas shown in panels above. A colour version of this figure with merged images of the two colours shown on the left is published in Molecular Membrane Biology online.
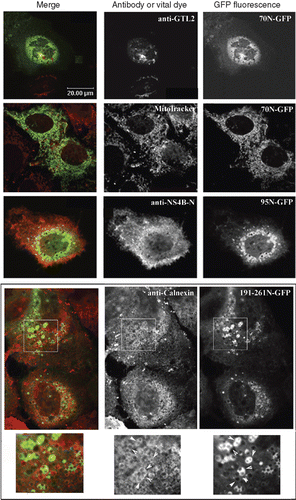
Figure 5. Partition of the GFP chimeric NS4B mutants into sodium carbonate extracted membranes. WRL68 cells, expressing GFP chimeric NS4B mutants or NS4B-GFP or GFP, were subjected to subcellular fractionation (methods) 40 h p.t. and the isolated membrane fractions were treated with 100 mM sodium carbonate pH 11.5 (methods). Proteins were analyzed by SDS PAGE (12% w/v) and Western Blot. Nitrocellulose filters were probed with the anti-GFP (0.45 μg/ml) pAb followed by the goat anti-rabbit HRP conjugated pAb and developped by the ECL system (A) and were subsequently stripped of the anti-GFP and anti-rabbit Abs, reprobed with the anti-calnexin pAb (1:2000) and the anti-rabbit HRP conjugated Ab and developped with the diaminobenzidine chromogen as a substrate for the reaction (B). Total: 1/60th of the cell homogenate subjected to centrifugation at 200,000 g, after removal of nuclei and unbroken cells; M1: membrane fraction, 1/60th of the membrane pellet collected by the 200,000 g centrifugation; S1: supernatant of the first 200,000 g centrifugation, 1/60th of the soluble fraction; M2: membranes after sodium carbonate extraction, 1/3rd of the total membrane fraction (20× more concentrated sample from M1); S2: 1/3rd of the proteins extracted with sodium carbonate treatment of the M1 fraction.
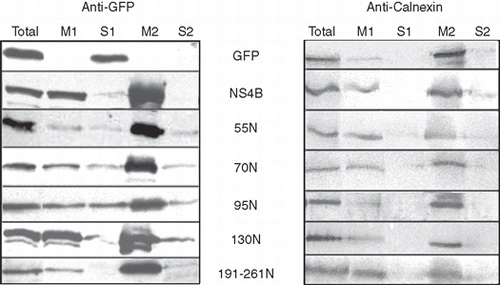
Figure 6. (A) ER Transmembrane topology model of the human placental CD39 protein encoded by the hpCD39 plasmid [Citation35]. Numbering corresponds to extramembrane regions. (B) Schematic representation of the GFP-CD39 chimeric NS4B mutants. Regions of the NS4B N-terminal half were inserted between the GFP and the CD39 coding sequences as described in methods. White boxes: NS4B sequence; Light grey boxes: CD39 sequence; Dark grey boxes: GFP sequence. Dark gray vertical bars: the position of the putative NS4B and CD39 TM helices. The NS4B residues in the chimeras are numbered at the beginning and the end of the white boxes. The molecular size of the chimeras is indicated on the right.
![Figure 6. (A) ER Transmembrane topology model of the human placental CD39 protein encoded by the hpCD39 plasmid [Citation35]. Numbering corresponds to extramembrane regions. (B) Schematic representation of the GFP-CD39 chimeric NS4B mutants. Regions of the NS4B N-terminal half were inserted between the GFP and the CD39 coding sequences as described in methods. White boxes: NS4B sequence; Light grey boxes: CD39 sequence; Dark grey boxes: GFP sequence. Dark gray vertical bars: the position of the putative NS4B and CD39 TM helices. The NS4B residues in the chimeras are numbered at the beginning and the end of the white boxes. The molecular size of the chimeras is indicated on the right.](/cms/asset/f20b2261-bcaa-44ee-925e-59c8bf47d393/imbc_a_442821_f0006_b.gif)
Figure 7. Localization of the GFP-CD39 chimeric NS4B mutants in Huh7 cells. Huh7 cells expressing GFP-CD39 chimeric NS4B mutants or GFP-CD39. Localization of the GFP chimeras was analyzed 24 h p.t. by confocal microscopy. Representative images of the GFP auto fluorescence are shown in black and white
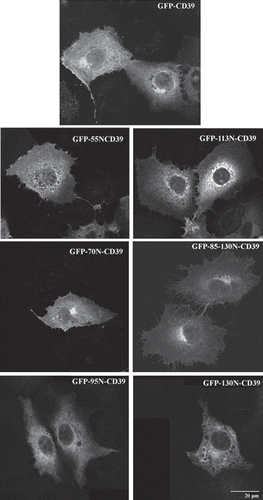
Figure 8. (A) Extracellular detection of the CD39 ecto domain in the GFP-CD39 chimeric NS4B mutants. Huh7 cells expressing GFP-CD39 chimeric NS4B mutants or GFP-CD39 were stained 24 h p.t. without fixation with the mouse anti-CD39 mAb followed by the anti-mouse Alexa546 pAb and were subsequently fixed and mounted on coverslips. Merged images of the green (GFP) and red (Alexa546) fluorescence are presented. The red fluorescence denotes the extracellular localization of the CD39 ecto-domain. (B) Cell surface ATPase activity of the GFP-CD39 chimeric NS4B mutants. ATPase activity of intact WRL68 cells transiently expressing the GFP-CD39 chimeric NS4B mutants, was measured at 24 or 44 h p.t. in the presence of ATP and was expressed as the percentage of the ATPase activity in cells expressing GFP-CD39. The estimated ATPase activity values for each chimera were normalized for the population of transfected cells estimated by FACS (methods). Activity assays were performed in duplicates in at least two independent experiments. Error bars represent standard errors (for two values from independent experiments).
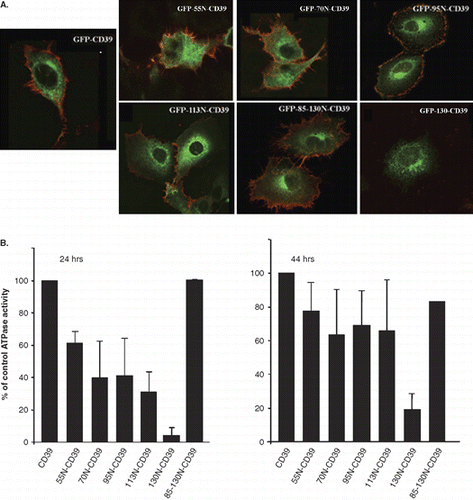
Figure 9. Suggested boundaries for TM1 and TM2 in the NS4B N-terminal half. The NS4B primary structure between residues 66-135 is shown. The sequences proposed as TM1 and TM2 helices are presented in grey background framed by broken line. The Pro residues, and the putative Nucleotide Binding site (NBD [Citation31]) are underlined and indicated in bold. Under each residue is shown the PROF (http://www.aber.ac.uk/∼phiwww/prof/) prediction for being in a helix (H), in a coil (C) or a b-strand. The helical regions consisting of residues with prediction reliability accuracy for being in a helix > 0.6 (Supplementary Figure S2, online version), are indicated as H1, H2 and H3 and are underlined. Helices H2 and H3 show < 25% solvent accessibility in their entire length and < 5% solvent accessibility in their 10 central residues. Residues 110-113, framed with a solid line, are proposed to form the ER luminal loop connecting TM1 and TM2.
![Figure 9. Suggested boundaries for TM1 and TM2 in the NS4B N-terminal half. The NS4B primary structure between residues 66-135 is shown. The sequences proposed as TM1 and TM2 helices are presented in grey background framed by broken line. The Pro residues, and the putative Nucleotide Binding site (NBD [Citation31]) are underlined and indicated in bold. Under each residue is shown the PROF (http://www.aber.ac.uk/∼phiwww/prof/) prediction for being in a helix (H), in a coil (C) or a b-strand. The helical regions consisting of residues with prediction reliability accuracy for being in a helix > 0.6 (Supplementary Figure S2, online version), are indicated as H1, H2 and H3 and are underlined. Helices H2 and H3 show < 25% solvent accessibility in their entire length and < 5% solvent accessibility in their 10 central residues. Residues 110-113, framed with a solid line, are proposed to form the ER luminal loop connecting TM1 and TM2.](/cms/asset/a0987bca-5c5c-4bdd-8d74-46842835c2bb/imbc_a_442821_f0009_b.gif)