Figures & data
Figure 1. Comparison of the deduced aa sequences of L. japonicus LjPLT1, LjPLT2, LjPLT3 and LjPLT4 with previously characterized monosaccharide transporters. Sequences shown include: AtPLT5, Arabidopsis thaliana polyol transporter (NP_188513); AgMAT1, Apium graveolens mannitol transporter (AAG43998); PmPLT1, Plantago major polyol transporter 1 (CAD58709); PcSOT1, Prunus cerasus sorbitol transporter 1 (AAO39267). Identical residues are boxed in black, whereas conservative changes are shown in grey. Dashes represent gaps inserted to optimize the alignment. Sequences were aligned using ClustalW with PAM250 residue weight table. Transmembrane helices of LjPLT4 as predicted by HMMTOP software are indicated by the black line. The dashed lines indicate PESPRXL, LPETKGXXXE and two GRR conserved motifs.
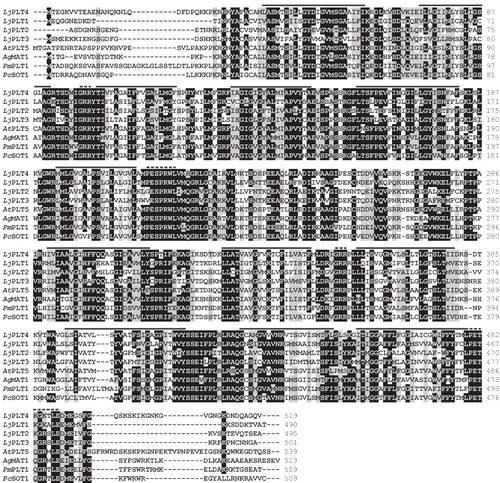
Figure 2. Phylogenetic relationships of L. japonicus LjPLT1, LjPLT2, LjPLT3 and LjPLT4 amino acid sequences to other sucrose, monosaccharide and polyol transporters. Full length amino acid sequences were aligned with the ClustalW program. Evolutionary history was inferred using the Neighbor-Joining method and evolutionary distances were computed using the Poisson correction method. The tree is drawn to scale, with branch lengths in the same units as those of the evolutionary distances used to infer the phylogenetic tree. Bootstrap values from 1,000 replicates are given at each node. Phylogenetic analyses were conducted using MEGA4 (Tamura et al. Citation2007). Sequences included as follows: AtPLT5, Arabidopsis thaliana PLT5 (NP_188513); AtPLT1, A. thaliana PLT1 (NP_179209); AgMAT1, Apium graveolens mannitol transporter (AAG43998); PmPLT1, Plantago major polyol transporter 1 (CAD58709); MdSOT1, Malus domestica sorbitol transporter 1 (AAO88964); PcSOT2, Prunus cerasus putative sorbitol transporter (AAM44082); OsPST2, Oryza sativa putative sugar transporter (AAL14615); AtPLT6, A. thaliana putative mannitol transporter (NP_195385.1); LbXYLT, Lactobacillus brevis D-xylose proton-symporter (AAC95127.1); AtMSS1, A. thaliana carbohydrate transmembrane transporter (NP_198006); VvMST, Vitis vinifera putative hexose transporter (XP_002281683); AtSTP3, A. thaliana monosaccharide transporter (CAA05384); AtSTP4, A. thaliana sugar transporter 4 (NP_188627); OsMST3, O. sativa monosaccharide transporter 3 (BAB19864); NtMSTP1, Nicotiana tabacum monosaccharide transporter (CAA47324.1); MtMST1, Medicago truncatula sugar transporter (AAB06594); AtSTP1, A. thaliana sugar transporter 1 (NP_172592); DgMST, Datisca glomerata monosaccharide-H+ symporter (CAD30830.1); OsSUC, O. sativa putative sucrose transporter (ABF94212.1); AtSUT2, A. thaliana sucrose transporter 2 (NP_973404); LjSUT4, Lotus japonicus sucrose transporter 4 (CAD61275); VvSUC, V. vinifera sucrose transporter (AAD55269); AtSUT4, A. thaliana sucrose transporter (AAG09191); PmSUC1, P. major sucrose transporter (CAI59556); NtSUT1a, N. tabacum sucrose transporter (CAA57727); AtSUC2, A. thaliana sucrose-proton symporter 2 (NP_173685.1); AtSUC9, A. thaliana sucrose-proton symporter 9 (NP_196235.1).
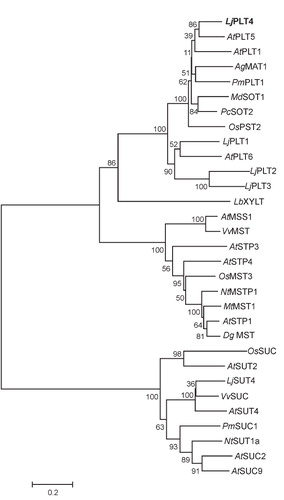
Figure 3. Subcellular localization of LjPLT4-GFP fusion protein in Saccharomyces cerevisiae and of LjPLT4-eYFP transiently expressed in Arabidopsis thaliana leaf epidermal cells. GFP and eYFP fluorescence was detected by confocal microscopy. Localization of GFP (A) and LjPLT4-GFP (B) in yeast cells and localization of eYFP (C) and LjPLT4-eYFP (D) in Arabidopsis epidermal cells are presented in colour in the online version. n: nucleus; p: plasma membrane.
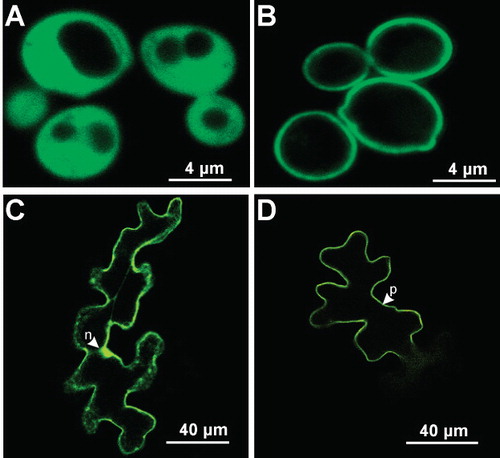
Figure 4. Relative uptake levels of various radiolabelled substrates in LjPLT4 yeast expressing cells (pDR196+LjPLT4 transformed). Relative uptake levels are expressed as percentage of the uptake of the tested substrate by LjPLT4-expressing yeast cells, in relation to the uptake of the respective substrate by yeast cells transformed with the empty pDR196 vector (arbitrary set as 100%). The pH conditions, the different polyols/sugars tested and their concentration in the uptake reaction are shown below the bar graph. The incubation time of the uptake reactions was 3 min. The results are means ± SE of four replicates (n = 4).
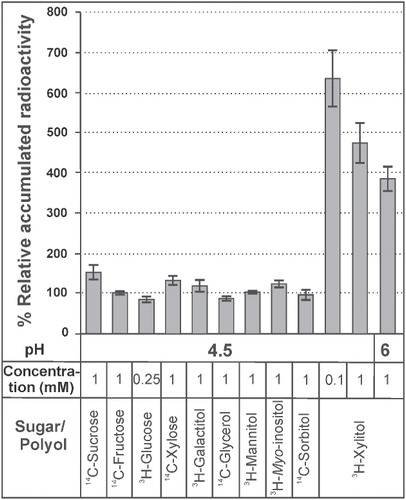
Table I. Inhibition of 3H-xylitol transport by various potential competitors and inhibitors. Uptake of 3H-xylitol was determined in the presence of other substrates. External xylitol concentration was 0.7 mM at pH 4 and 3 mM at pH 8, and a 10-fold excess of the other compounds was used. The incubation time of each uptake reaction was 3 min. Results are means ±SE of four replicates. n.d.: not determined.
Figure 5. pH-dependence of xylitol uptake by transformed yeast cells expressing LjPLT4. Reactions were performed at the pH values indicated using 1 mM xylitol. Incubation time was 3 min. Results represent the net uptake of xylitol by the LjPLT4 expressing cells. The results are the means ± SE of four replicates (n = 4).
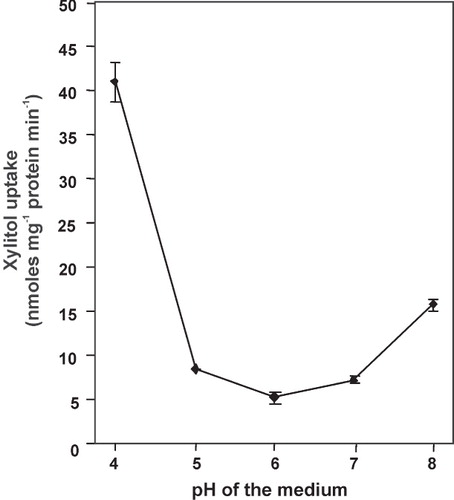
Figure 6. Concentration dependence of xylitol uptake in LjPLT4-expressing yeast cells at pH 4 (A) and at pH 8 (B). The incubation time of the uptake reaction was 3 min. Results are means ± SE of four replicates (n = 4). Lineweaver-Burk plots of uptake rates are shown in the insets.
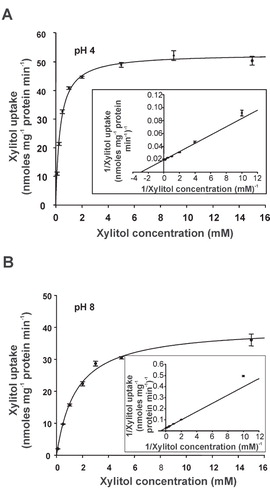
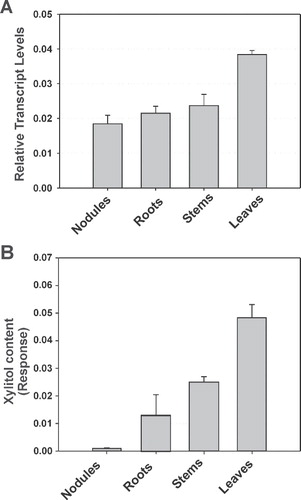
Figure 7. Quantitative RT-PCR analysis of LjPLT4 mRNA expression and GC-MS analysis of xylitol in L. japonicus organs. (A) Accumulation of LjPLT4 gene transcripts in different plant organs. Total RNA was isolated and poly(A)+-RNA was reverse transcribed to cDNA, and subjected to real-time quantitative PCR using gene specific primers. Relative mRNA level was calculated relative to the level of the ubiquitin transcripts. Bars show means +SD (n = 4). (B) Xylitol accumulation in different plant organs. Metabolites were extracted, derivatized, and analyzed by gas chromatography coupled to mass spectrometry (GC-MS), as described in Material and methods. Xylitol accumulation is expressed as a relative response ratio (Desbrosses et al. Citation2005). Bars represent the average response of five independent biological repeats +SD (n = 5).