Figures & data
Figure 1. (a) Hypertonic media elicit a cortical patchy appearance of A. nidulans GFP-tagged transporters observed by epifluorescence microscopy. Upper panel: Control samples (–) were grown for 13 h in MM (urea 5 mM, glucose 1%) at 25°C, which permit the induction of transporters during conidiospore germination (Pantazopoulou and Diallinas Citation2007). Lower panels: Samples grown similarly as control samples, but then transferred to the same media containing 0.8 M Sucrose (Suc) or 0.5 M NaCl. Here and in several subsequent Figures, images were converted to 8-bit inverted grayscale. (b) Confocal laser scanning microscopy of UapA-GFP cellular expression in control media (–) or after 1 min exposure to 0.8 M Sucrose (Suc). (c) Epifluorescence microscopy of a strain expressing simultaneously UapA-mRFP and AzgA-GFP in control (–) or hypertonic (Suc, NaCl) media. Notice the overlap of red and green fluorescence (merge). Scale bars shown here and in subsequent figures correspond to 5 μm unless otherwise stated.
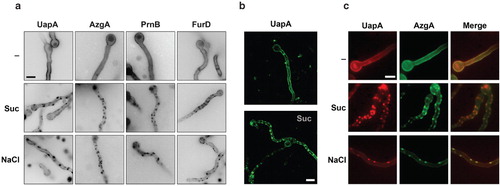
Table I. Strains used in this study.
Figure 2. (a) Kinetics of appearance of cortical patches in a strain expressing UapA-GFP from the alcA promoter (alcAp -UapA-GFP) in hypertonic media (1 min) in response to tonicity strength. Samples were grown for 14–15 h in mM (urea 5 mM, fructose 0.1%), at 25°C, which permits the induction of UapA-GFP from alcAp (Gournas et al. Citation2010). (b) Disassembly of alcAp -UapA-GFP fluorescent patches after prolonged growth (2, 4 or 16 h) in hypertonic media (Suc or NaCl). (c) Wash-out of alcAp-UapA-GFP fluorescent patches (NaCl) after 10 min transfer to control (–) media. The figure shows epifluorescence microscopy images. Scale bars shown are 10 μM.
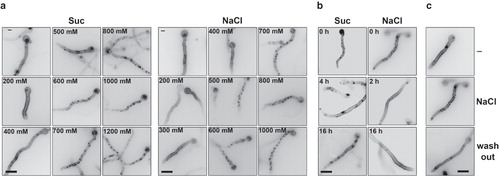
Figure 3. Examination by epifluorescence microscopy of UapA-specific fluorescent cortical patches after treatment with various salts (0.5 M), sugars (0.8 M), cycloheximide (chx, 20 μg/ml, 15 min prior to examination), different pH or the proton gradient uncoupler CCCP (30 μM, 15 min prior to examination). UapA-GFP is expressed from the the alcA promoter (alcAp -UapA-GFP) as described in . Sor and Man stand for Sorbitol and Mannitol, respectively. Notice that only monovalent ions and sugars (mostly Sor), which are known to produce hypertonic stress, lead to fluorescent patches.
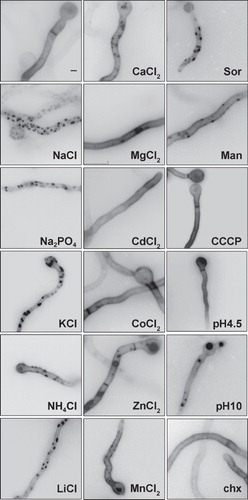
Figure 4. Fluorescent, UapA-GFP specific (alcAp -UapA-GFP), patches correspond to plasma membrane invaginations visible (highlighted with arrow heads) in deconvoluted images obtained with an inverted Leica microscope with motorized z-focus. Maximal intensity projections obtained from z-stacks using the Metamorph 3D are shown (see Experimental section). Two samples treated with sucrose (0.8 M) are shown compared with an untreated control.
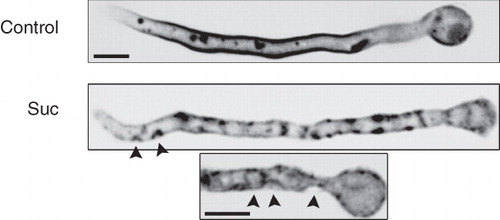
Figure 5. (a) Fluorescent patches detected with membrane-associated molecular markers other than transporters in hypertonic conditions. ‘PH domain’ is a GFP-tagged duplication of the PLC-δ1 PH domain which acts as an exclusive marker for the plasma membrane through its high affinity binding of PI(4,5)P2 lipids. SsoA is a GFP-tagged t-Snare exocytic protein that attaches to the inner leaflet of the plasma membrane. Filipin and FM4-64 are fluorescent lipophilic markers labeling the plasma membrane under specific conditions (see Experimental section). Calcofluor white staining (see Materials and methods) showing overlap of UapA-GFP patches with deposition of cell wall material (highlighted with arrows). (b) Extractability of UapA-GFP by Triton X-100 from plasma membranes is identical in standard media and after exposure to hypertonic treatment (0.8 M sucrose, 10 min). (c) UapA-mediated (alcAp -UapA-GFP) 3H-xanthine transport capacity in standard media and after exposure to hypertonic treatment (0.8 M sucrose, 10 min). The K m value of UapA-GFP (alcAp -UapA-GFP) for xanthine, established in hypertonic media, is also shown (8 μM). For details of uptake studies, see Experimental section.
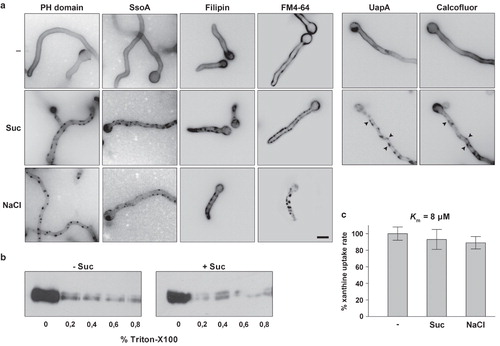
Figure 6. (a) Hypertonic media elicit a blockage of UapA-GFP endocytosis. In control samples UapA-GFP (alcAp -UapA-GFP) endocytosis is elicited upon transfer for 1h to standard media with either 1 mM uric acid (UA) or 20 mM ammonium ions (NH4) (Gournas et al. Citation2010). Under these conditions, UapA-GFP is internalized and degraded in the vacuoles (appearing as prominent fluorescent granules in the cytoplasm) through sorting in the MBV pathway. Here and in all subsequent Figures, unless otherwise stated, hypertonic conditions are imposed by transfer to standard media with 0.8 M sucrose or 0.5 M NaCl. Notice that after hypertonic treatment there are UapA-GFP cortical fluorescent patches but no vacuoles visible in conditions that normally lead to UapA-GFP turnover. (b) UapA-GFP (alcAp -UapA-GFP) endocytosis by ammonium in a control sample and blockage of UapA-GFP endocytosis by ammonium after hypertonic treatment, as seen with inverted confocal laser microscopy in a single hypha. (c) Western blot analysis of membrane protein fractions corresponding to 2 h addition of UA or NH4 and controls (–), probed with anti-GFP. The low mobility band corresponds to intact UapA-GFP (alcAp -UapA-GFP) and the high mobility band to free GFP produced through vacuolar degradation of UapA (see text). (d) Recovery of NH4-elicited endocytosis of UapA-GFP (alcAp -UapA-GFP) after prolonged growth (16 h) in hypertonic media. (e) Minimal concentrations of sucrose or NaCl blocking endocytosis. (f) Effect of hypertonic treatment on FM4-64 internalization. The strain used is alcAp -UapA-GFP. Control and hypertonic samples were treated as previously. Upon 15 min of staining on ice and 30 sec transfer to 25°C, FM4-64 labels only the plasma membrane, which appears uniform in control media but patchy after sucrose treatment. A practically identical labeling was obtained with UapA-GFP (left panels). After 30 min of incubation at 25° in untreated samples, FM4-64 still labeled the plasma membrane but was mostly localized in endosomal compartments. In sharp contrast, in sucrose treated samples, FM4-64 still labeled cortical patches associated with plasma membrane and no sign of internalization was evident. The cortical fluorescent patches labeled with FM4-64 are identical with those labeled with UapA-GFP (right panels).
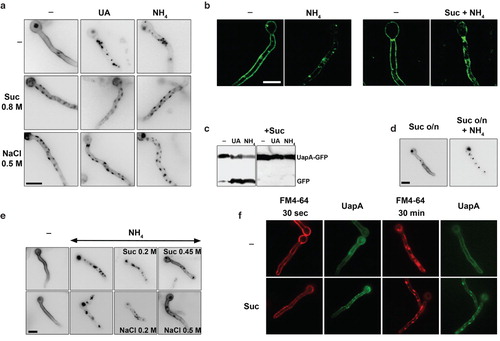
Figure 7. Hypertonic media elicit growth arrest of A. nidulans. (a) Growth tests of two isogenic strains expressing UapA-GFP from either its native promoter (used for Figure 1) or from the alcA promoter (used for all other Figures). 0.5 NaCl was used for hypertonic treatment and tests were carried out in MM with fructose (0.1%) or glucose (1%), as carbon sources. NaCl led to a reduction of both the diameter of colonies and conidiospore production. The reduction of growth was stronger in fructose media. (b) Reduction of hyphal length upon addition of either 0.8 M sucrose or 0.5 M NaCl for 4 h in the strain expressing alcAp-UapA-GFP grown in fructose media.
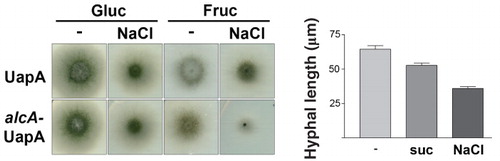
Figure 8. Hypertonicity and Lat-B effects on actin dynamics and the endocytic machinery. (a) Cellular localization of SlaB, AbpA and of TpmA, tagged with either GFP or mRFP, under standard or hypertonic growth conditions. Samples were treated as previously described. SlaB-GFP and AbpA-mRFP form cortical foci which predominate at the tip of hyphae under all conditions. GFP-TpmA in standard conditions (–) labels diffusely the cytocol and more strongly actin-like cables along the hyphal length and the tip. In hypertonic conditions (Suc) labeling of the actin cables and the tip disappears and scattered cortical patches appear along the hyphal length. (b) Effect of Lat-B (50 μM) on the cellular localization of UapA (-GFP or -mRFP tagged) in standard (–), endocytic (NH4) or hypertonic (Suc) conditions. The effect of Lat-B on AbpA-GFP and SlaB-GFP was also examined as a control. Lat-B leads to the disassembly of all AbpA patches as expected (Araujo-Bazán et al. Citation2008), but has a minor effect on SlaB, as only the patches at the tip seem to disassemble. Lat-B has no effect on either the normal uniform localization of UapA in the plasma membrane in standard media (–) or on the appearance of UapA-specific fluorescent patches (plasmolysis) in hypertonic media (Lat-B + Suc and Lat-B + NaCl). In contrast, Lat-B blocked the internalization of UapA by NH4. Note that in the latter case, UapA cortical foci are also visible (highlighted with arrows).
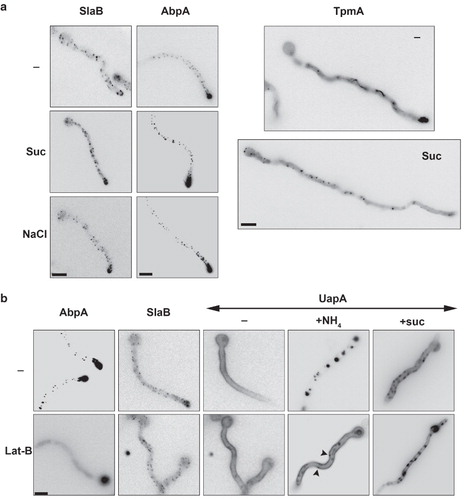
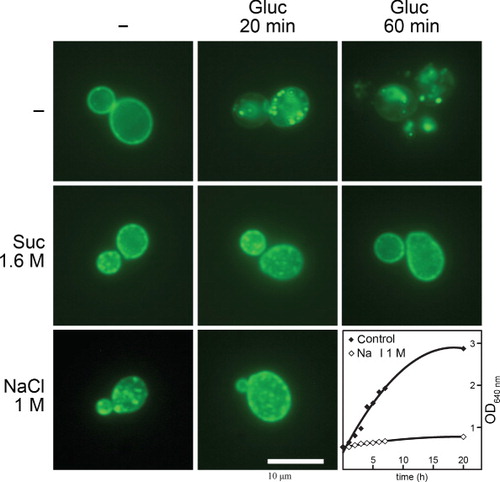
Figure 9. Hypertonic conditions elicit similar phenomena in S. cerevisiae as in A. nidulans. Epifluorescence microscopy images of a S. cerevisiae strain expressing a functional Jen1p-GFP chimeric transporter are shown. Jen1p-GFP is expressed uniformly in the plasma membrane under standard conditions of induction (–) but is rapidly internalized (20 min) and eventually degraded in the vacuole (60 min) upon addition of 1% glucose (Paiva et al. Citation2009). Hypertonic treatment (1.6 M sucrose or 1 M NaCl) for 1 min leads to the appearance of mostly cortical fluorescent patches and shows no evidence of internalization or degradation of Jen1p-GFP by glucose. The last panel shows the growth arrest elicited by addition of 1 M NaCl in the Jen1p-GFP strain at an OD640 nm of 0.5. For more technical details, see the Experimental section.