Figures & data
Figure 1. Co-expression of AMPK decreased voltage-gated outward current in KCNQ1/KCNE1 expressing Xenopus oocytes. (A) Original tracings of the current induced by depolarization from −60 mV to −40, −20, 0, 20, 40, 60, and 80 mV in Xenopus oocytes injected with water (a), expressing KCNQ1/KCNE1 without (b) or with (c) additional co-expression of wild type AMPK, of kinase dead mutant αK45RAMPK (d) or of constitutively active γR70QAMPK (e). (B) Arithmetic means ± SEM (n = 22–36) of depolarization-induced K+ current at +80 mV in Xenopus oocytes injected with water (1st bar), expressing KCNQ1/KCNE1 without (2nd bar) or with additional coexpression of wild type AMPK (3rd bar), of kinase dead mutant K45RAMPK (4th bar) or of constitutively active R70QAMPK (5th bar). ***(p < 0.001) indicates statistically significant difference from the values obtained in oocytes expressing KCNQ1/KCNE1 alone. (C) Arithmetic means ± SEM of depolarization-induced current (Ig) as a function of the potential in Xenopus oocytes injected as in B. (D) Arithmetic means ± SEM (n = 12–24) of depolarization-induced K+ current at +80 mV in Xenopus oocytes injected with water (1st bar), expressing KCNQ1/KCNE1 without (2nd bar) or with additional co-expression of constitutively active R70QAMPK (3rd bar). The oocytes were incubated in the absence (white bars) or presence of 10 μM AMPK inhibitor compound C (black bars) for the indicated number of hours prior to the experiment. ***(p < 0.001) indicates statistically significant difference from the values obtained in oocytes expressing KCNQ1/KCNE1 alone. #, ### (p < 0.05, p < 0.001) indicate significant difference from the absence of compound C. (E) Arithmetic means ± SEM (n = 8–17) of depolarization-induced K+ current at +80 mV in Xenopus oocytes injected with water (1st bar), expressing KCNQ1/KCNE1 without (2nd bar) or with additional coexpression of constitutively active R70QAMPKα2 (3rd bar). ### (p < 0.001) indicates significant difference from the absence of R70QAMPKα2.
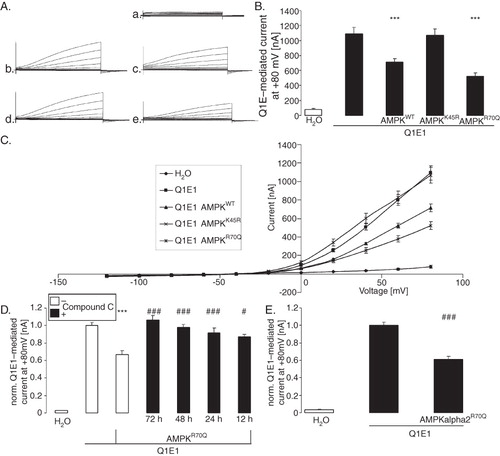
Figure 2. Co-expression of AMPK did not significantly modify activation kinetics of voltage-gated outward currents in KCNQ1/KCNE1-expressing Xenopus oocytes. Arithmetic means ± SEM (n = 31–36) of the time constant (τ) plotted vs. the depolarizing potential in Xenopus oocytes expressing KCNQ1/KCNE1 alone (closed symbols) or KCNQ1/KCNE1 together with constitutively active R70QAMPK (open symbols).
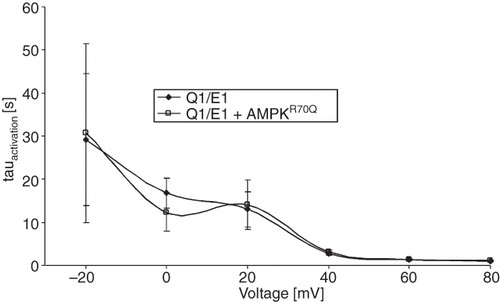
Figure 3. Co-expression of AMPK decreased the KCNQ1 protein abundance within the plasma membrane of oocytes. (A) Confocal images of KCNQ1 protein abundance in the plasma membrane of Xenopus oocytes injected with water (2nd upper panel), expressing KCNQ1/KCNE1 without (3rd upper panel) or with additional co-expression of wild type AMPK (1st lower panel), of kinase dead mutant αK45RAMPK (2nd lower panel) or of constitutively-active γR70QAMPK (3rd lower panel). The cells were subjected to immunofluorescent staining using FITC-conjugated antibody (grey/green). The 1st upper panel serves as control (absence of primary antibody). (B) Original Western Blots of total KCNQ1 (upper panel) and GAPDH (lower panel) in Xenopus oocytes injected with water (1st lane), expressing KCNQ1/KCNE1 without (2nd lane) or with additional co-expression of wild-type AMPK (3rd lane), of kinase dead mutant αK45RAMPK (4th lane) or of constitutively-active γR70QAMPK (5th lane). The lower bar diagram displays the densitometric analysis of the Western blots (arithmetic means ± SEM [n = 3]).
![Figure 3. Co-expression of AMPK decreased the KCNQ1 protein abundance within the plasma membrane of oocytes. (A) Confocal images of KCNQ1 protein abundance in the plasma membrane of Xenopus oocytes injected with water (2nd upper panel), expressing KCNQ1/KCNE1 without (3rd upper panel) or with additional co-expression of wild type AMPK (1st lower panel), of kinase dead mutant αK45RAMPK (2nd lower panel) or of constitutively-active γR70QAMPK (3rd lower panel). The cells were subjected to immunofluorescent staining using FITC-conjugated antibody (grey/green). The 1st upper panel serves as control (absence of primary antibody). (B) Original Western Blots of total KCNQ1 (upper panel) and GAPDH (lower panel) in Xenopus oocytes injected with water (1st lane), expressing KCNQ1/KCNE1 without (2nd lane) or with additional co-expression of wild-type AMPK (3rd lane), of kinase dead mutant αK45RAMPK (4th lane) or of constitutively-active γR70QAMPK (5th lane). The lower bar diagram displays the densitometric analysis of the Western blots (arithmetic means ± SEM [n = 3]).](/cms/asset/a8c6fe6f-e214-43c9-b721-166ffd71f0c3/imbc_a_520037_f0003_b.jpg)
Figure 4. Similar to γR70QAMPK the ubiquitin ligase Nedd4-2 downregulated KCNQ1/KCNE1. (A) Original tracings of the current induced by depolarization from −60 mV to −40, −20, 0, 20, 40, 60, and 80 mV in Xenopus oocytes injected with water (a), expressing KCNQ1/KCNE1 without (b,d) or with (c,e) additional coexpression of constitutively active γR70QAMPK in the absence (b,c) or presence (d,e) of Nedd4-2. (B) Arithmetic means ± SEM (n = 10–19) of depolarization-induced current at +80 mV in Xenopus oocytes injected with water (H2O), expressing KCNQ1/KCNE1 (Q1E1) without or with additional co-expression of constitutively active R70QAMPK (AMPKR70Q) in the absence (open bars) or presence (closed bars) of Nedd4-2. *** (p < 0.001) indicates statistically significant difference from the values obtained in oocytes expressing KCNQ1/KCNE1 alone. (C) Arithmetic means ± SEM (n = 11–14) of depolarization-induced current at +80 mV in Xenopus oocytes injected with KCNQ1/KCNE1 without (white bars) or with additional coexpression of constitutively active R70QAMPK (black bars) in the absence (2 left bars) or presence of Nedd4-2 (2 middle bars) or of Nedd4-2S795A (2 right bars). *** (p < 0.001) indicates statistically significant difference from the values obtained in oocytes expressing KCNQ1/KCNE1 alone. # (p < 0.05) indicates statistically significant difference from the absence of R70QAMPK.
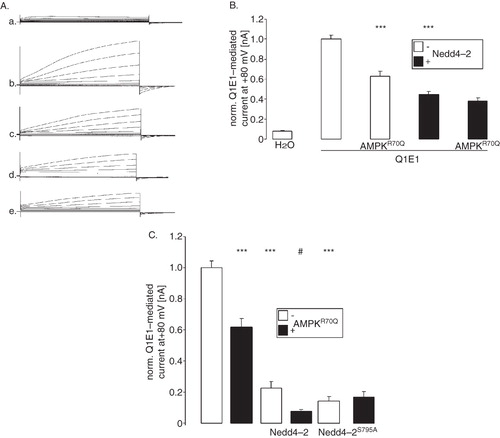
Figure 5. Similar to γR70QAMPK the ubiquitin ligase Nedd4-2 decreased the KCNQ1 protein abundance in the cell membrane. Confocal images of KCNQ1 protein abundance in the plasma membrane of Xenopus oocytes expressing KCNQ1/KCNE1 without (1st panel) or with additional coexpression of constitutively active γR70QAMPK (2nd panel), of the ubiquitin ligase Nedd4-2 (3rd panel) or of both, γR70QAMPK and Nedd4-2 (4th panel). The cells were subjected to immunofluorescent staining using FITC-conjugated antibody (grey/green).
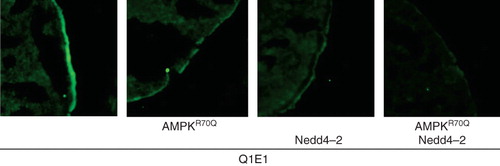
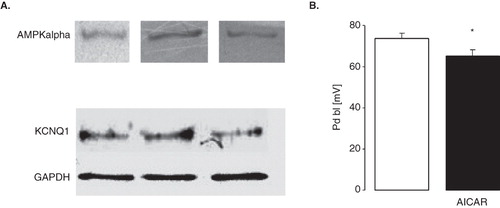
Figure 6. Depolarization of proximal renal tubule cells by stimulation of AMPK (A) Original Western Blots demonstrating expression of AMPKα (upper panel) and KCNQ1 (lower panel; GAPDH was used as loading control) in isolated proximal tubules of C57 BL/6 mice. (B) Arithmetic means ± SEM (n = 7–8) of the potential difference across the basolateral membrane (PD) of isolated perfused proximal renal tubules from C57 BL/6 mice incubated for 1 h at 22°C in the absence (left bar) or presence (right bar) of AMPK stimulator AICAR (10 mM). * (p < 0.05) indicates statistically significant difference from the values obtained in absence of AICAR.