Figures & data
Figure 1. ASA modulates phagocytosis in DC and macrophages. (A) DC2.4 were incubated with various concentrations of ASA (0, 1, 2, 3, 4, 8, 9, and 10 mM) in DMEM for 18 h prior to incubation with fluorescence-labelled bioparticles (E. coli) in a phagocytosis assay. The amount of fluorescent bioparticles (E. coli) ingested by the control and ASA-treated cells was quantified using Gemini EN plate reader. (B) RAW264.7 cells were incubated with various concentrations of ASA (0, 0.1, 0.5, 1, 2, 3, 4, 5, 6, and 7 mM) in DMEM for 18 h prior to incubation with fluorescence-labelled bioparticles (E. coli) in a phagocytosis assay. The amount of fluorescent bioparticles (E. coli) ingested by the control and ASA-treated cells was quantified using Gemini EN plate reader.
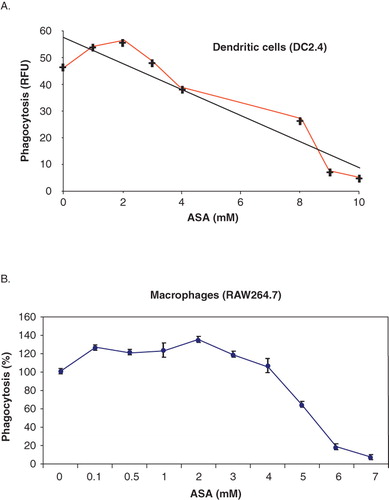
Figure 2. ASA regulates expression of endosomal SNARE proteins (A) Western blot analysis of endogenous Vti1a, Vti1b, VAMP-3, VAMP-8, Syn-6, Syn-8, and Syn-16 expression in control and ASA-treated DC2.4 cells. Lysates were prepared from control and ASA (5 mM)-treated primary DC, separated by 12% SDS-PAGE gel and immunoblotted using Vti1a, Vti1b, VAMP-3, VAMP-8, Syn-6, Syn-8, and Syn-16 specific antibodies. (B) Quantification of protein bands in ‘A’. Representative from three independent experiments is shown.
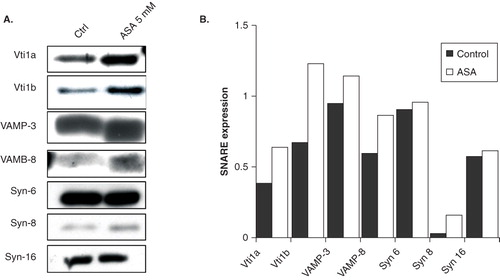
Figure 3. The ASA-mediated mitigation of phagocytosis in DC is dependent on Vti1a and Vti1b expression. (A) Panel a: Phagocytosis inhibitory effect of ASA on DC2.4 was reduced upon silencing of Vti1a and Vti1b by siRNA transfection. Scramble siRNA was used as control. Panel b: The same set of cells used in the phagocytosis assay in C was stained with Vti1a- and Vti1b-specific monoclonal antibodies to verify successful knock-down of these SNARE proteins. (B) Vti1a recruits to GFP-E. coli-positive membrane compartment. DC2.4 were incubated with GFP-E. coli (green) for 1 h, fixed and viewed under the confocal microscope. Vti1a (red) colocalizes with the GFP-E. coli-positive membrane compartment (in yellow). Experiments were repeated at least two times. Size bar: 10 μm.
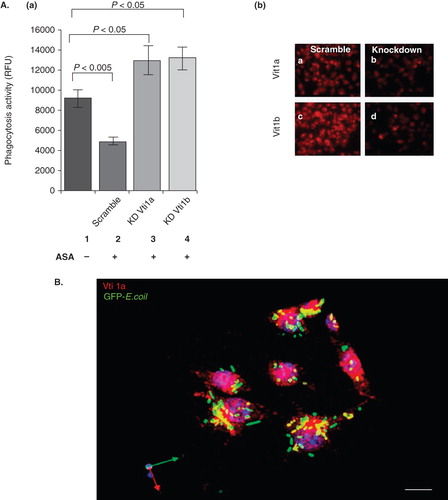
Figure 4. Significant amount of Vti1a and Vti1b recruited to the phagosomes upon bacteria ingestion. DC2.4 cells were incubated with GFP-E. coli (green) for 1 h prior to analysis by immunofluorescence microscopy. Cells without GFP-E. coli were used as a control. (A) Recruitment of Vti1a and Vti1b to the phagosomes were determined by immunofluorescense microscopy using antibodies against the respective SNARE proteins (in red). Stereo 3D convolution images showed the recruitment of Vti1a and Vti1b (in red) to the green GFP-E. coli-positive phagosomes (indicated by white arrows). Size bar: 5 μm. (B) Enrichment of Vti1a and Vti1b on phagosomes was quantified using Western blot analysis. DC2.4 cells were allowed to internalize GFP-E. coli for 1 h prior to phagosomal extraction as described in Methods. The phagosomal lysates were prepared and separated by 12% SDS-PAGE gel and immunoblotted using Vti1a, Vti1b and VAMP-3 specific antibodies. The phagosomal extract (PE) showed enrichment of the SNARE protein as compared to the total lysate (TL). Note that four times lower amount of PE (5 μg) was loaded onto the gel as compared to TL (20 μg). The band intensities were quantified using Image J software and normalized to the same amount of protein and presented on the bar chart. Representative from three independent experiments is shown.
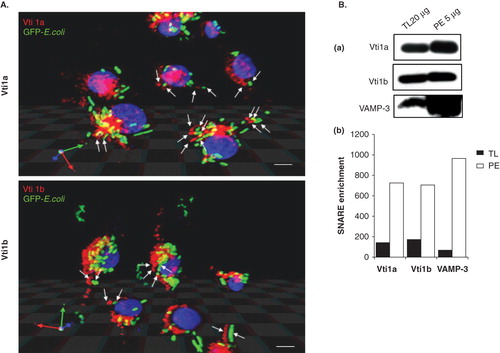
Figure 5. Up-regulation of Vti1a and Vti1b mitigates phagocytosis in DC. (A) Localization of cells over-expressing Myc-Vti1a and Myc-Vti1b were determined by immunofluorescense microscopy using anti-c-myc monoclonal antibody 24 h post-transfection. Transfection was performed using Effectene reagent. Size bar: 5 μm. (B) Panel a: DC2.4 cells were transfected with the indicated plasmids (pDMyc, pDMyc-Vti1a and pDMyc-Vti1b) and assayed for their phagocytic activity after 24 h post-transfection. Panel b: The corresponding Western blot shows the protein expression of Myc-Vti1a and Myc-Vti1b. Representative from at least three independent experiments was shown. (C) DC2.4 cells transfected with control plasmid and plasmids encoding Myc-Vti1a and Myc-Vti1b were incubated with GFP-E. coli for 15 min at 37°C (0 min time-point). Cells were washed to remove unbound bacteria, and further incubated at 37°C for 1, 1.5 and 2 h prior to quantification using a fluorescence ELISA reader. Panel a: Up-regulation of Vti1a and Vti1b in DC2.4 cells did not increase degradation of GFP-E. coli in the phagosomes. *P < 0.05. Panel b: The corresponding Western blot shows the protein expression of Myc-Vti1a and Myc-Vti1b. Representative from two independent experiments is shown.
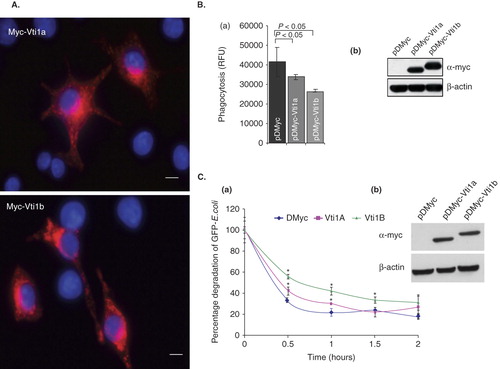
Figure 6. Vti1a and Vti1b negatively regulates phagocytosis in DC. (A) Mouse bone marrow-derived primary DC (murine primary DC) were transfected with in vitro transcribed Myc-Vti1a mRNA and stained with anti-CD11c and anti-c-myc specific antibodies were analyzed by flow cytometry. Panel a: Shows the CD11c+ murine primary DC population. Panel b: Shows the Myc-Vti1a-expressing murine primary DC populations. (B) Shows the integrity in vitro transcribed Myc-Vti1a mRNA as analyzed by formaldehyde gel. (C) Myc-Vti1a mRNA-transfected DC registered a reduction in phagocytosis activity as compared to control (luciferase mRNA- transfected primary DC). (D) Panel a: Vti1a and Vti1b genes were silenced in DC2.4 cells by siRNA transfection using Lipofectamine 2000. The cells were assayed for their phagocytic activity after 48 h post-transfection. Panel b: The corresponding Western blot analysis indicates successful silencing of Vti1a and Vti1b protein expression. Representative from three independent experiments is shown.
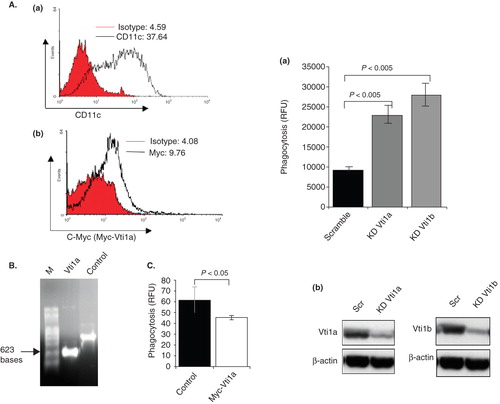
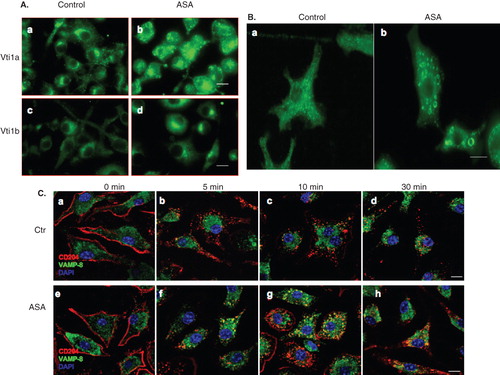
Figure 7. ASA induces redistribution of Vti1a, Vti1b, and scavenger receptor CD204 in DC. (A) Mouse bone marrow-derived primary DC (murine primary DC) were either untreated (Control) or treated with 5 mM ASA for 24 h in DMEM, fixed, and stained with Vti1a- and Vti1b-specific antibodies prior to viewing by immunofluorescense microscopy. ASA promotes redistribution of Vti1a and Vti1b in DC. Size bar: 10 μm. (B) Murine primary DC were treated with 5 mM ASA for 24 h in DMEM, fixed, and stained with CD204-specific antibody prior to viewing by immunofluorescense microscopy. CD204 localized to ASA-induced punctate membrane structures. Size bar: 5 μm. (C) Kinetics of endocytosed CD204 from the cell surface in the absence and presence of ASA. Murine primary DC were either untreated or pre-treated with 5 mM ASA for 4 h in DMEM, incubated with anti-CD204 monoclonal antibody on ice to label the cell surface CD204, transferred to 37°C to allow endocytosis of antibody-tagged cell surface CD204 in the presence of ASA, fixed cells at indicated time-points and stained with VAMP-8-specific rabbit polyclonal antibody prior to analyzing by immunofluorescense microscopy. In the presence of ASA, a significant pool of CD204 accumulated in the early/late endosomes marked by VAMP-8. Size bar: 10 μm.