Figures & data
Figure 1. Effect of intracellular Ter A and Ter B on the BKCa channels. (A) Chemical structures of Ter A and Ter B. (B) Representative single channel recordings in the absence and presence of Ter A or Ter B at +20 mV. Arrows indicate the closed state of the channel. The Po values for each trace are indicated at the right. (C) Statistical data for mean Po of the BKCa channels in the presence of Ter A (10 μM) or Ter B (10 μM). **p < 0.005 compared to the control.
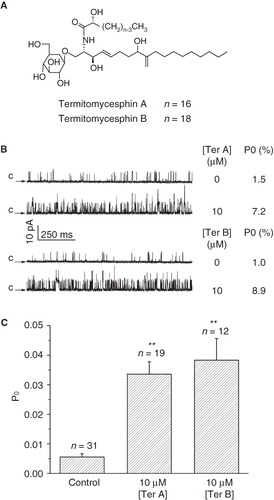
Figure 2. Time course of the BKCa channel activation by intracellular Ter A. Time course of single channel recordings in control condition (A) or upon intracellularly application of Ter A (B). 0 min denotes the time point of intracellularly application of DMSO or Ter A. (C) Current-voltage relationship for single-channel activities before and after application of Ter A. Each point represents mean ± SEM for at least 4 patches.
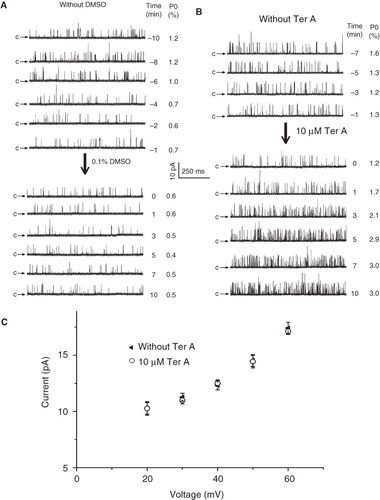
Figure 3. Dose-dependent effects of intracellular Ter A on the BKCa channels. (A) Representative single BKCa channel traces at +20 mV in the control and during successive exposure to different concentration of Ter A (1.25–10 μM) in the same patch. (B) Ter A increase the Po of BKCa channels in a dose-dependent manner. The curve is the best fit to Po against the [Ter A] according to the Hill equation. (C) Current traces before, during application and washout of 10 μM Ter A. (D) Statistical summary for the washout experiment. **p < 0.005 compared to the control and washout condition.
![Figure 3. Dose-dependent effects of intracellular Ter A on the BKCa channels. (A) Representative single BKCa channel traces at +20 mV in the control and during successive exposure to different concentration of Ter A (1.25–10 μM) in the same patch. (B) Ter A increase the Po of BKCa channels in a dose-dependent manner. The curve is the best fit to Po against the [Ter A] according to the Hill equation. (C) Current traces before, during application and washout of 10 μM Ter A. (D) Statistical summary for the washout experiment. **p < 0.005 compared to the control and washout condition.](/cms/asset/3bd381ec-859c-4768-96cf-42734fb1d73c/imbc_a_538731_f0003_b.jpg)
Figure 4. Effect of extracellularly applied Ter A on the BKCa channels. (A) Effect of 150 μM extracellular Ter A on Po over time at +20 mV. The recordings start (0 min) at the time when the inside-out patch was formed. Arrows indicate the closed state of the channels. (B) Statistical results of extracellular Ter A (10–150 μM) on Po of the channel at 10 min after formation of a giga-ohm seal at +20 mV. Values are mean ± SEM. **p < 0.005 compared to the control.
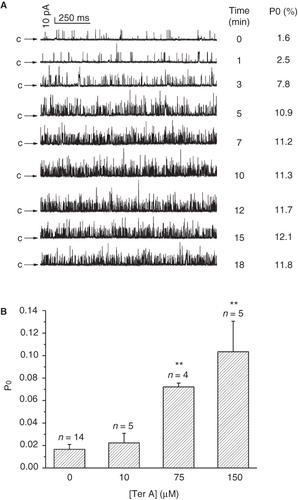
Figure 5. Effect of Ter A on the Ca2+-dependence of BKCa channel activation. Representative single channel current traces of the BKCa channels at [Ca2+]i ranging from 1 nM–50 μM before (A) and after (B) intracellular application of 10 μM Ter A at +20 mV. (C) The relationship between Po and [Ca2+]i in the absence and presence of 10 μM Ter A are fitted to a modified Hill equation (see text for detail). Each point is the mean ± SEM from at least five experiments.
![Figure 5. Effect of Ter A on the Ca2+-dependence of BKCa channel activation. Representative single channel current traces of the BKCa channels at [Ca2+]i ranging from 1 nM–50 μM before (A) and after (B) intracellular application of 10 μM Ter A at +20 mV. (C) The relationship between Po and [Ca2+]i in the absence and presence of 10 μM Ter A are fitted to a modified Hill equation (see text for detail). Each point is the mean ± SEM from at least five experiments.](/cms/asset/2fa1b381-698b-4e54-90a5-3facde629413/imbc_a_538731_f0005_b.jpg)
Figure 6. Effect of Ter A on the voltage-dependence of the BKCa channel activation. Representative single channel current traces of the BKCa channels at membrane potentials ranging from −50 to +60 mV in the absence (A) and presence (B) of 10 μM Ter A. (C) The relationships between the mean Po of the BKCa channels and the membrane potentials in the absence and presence of Ter A (1.25–10 μM) are fitted with the Boltzmann equation (see text for detail). Only the error bars for the control and 10 μM Ter A are shown for clarity.
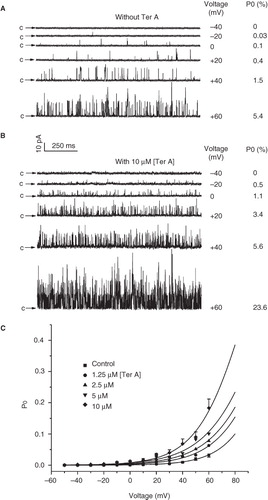
Figure 7. Comparison of the effect of Ter A on the activation of wild-type and STREX-deleted BKCa channels. Representative single channel current traces of the wild-type (A) and STREX-deleted (B) BKCa channels in the absence and presence of intracellularly applied Ter A. The membrane potential of the patch is +20 mV and [Ca2+]i is 10 μM. Arrows indicate the closed state of the channels. (C) Summary of the effect of Ter A on the mean Po of the wild-type and STREX-deleted BKCa channel. **p < 0.005 compared to the control.
![Figure 7. Comparison of the effect of Ter A on the activation of wild-type and STREX-deleted BKCa channels. Representative single channel current traces of the wild-type (A) and STREX-deleted (B) BKCa channels in the absence and presence of intracellularly applied Ter A. The membrane potential of the patch is +20 mV and [Ca2+]i is 10 μM. Arrows indicate the closed state of the channels. (C) Summary of the effect of Ter A on the mean Po of the wild-type and STREX-deleted BKCa channel. **p < 0.005 compared to the control.](/cms/asset/f9d0ab56-abe7-4395-b2b5-2aefba1b02e1/imbc_a_538731_f0007_b.jpg)