Figures & data
Figure 1. FRAP behaviour of CGN and CGNL1 in confluent MDCK cells. (A) High magnification images (left panels) and corresponding kymographs (right panels) of junctional segments at the indicated time points after photobleaching. Bar, 5 μm. (B) Fluorescence recovery curves for cingulin (CGN, grey squares) and paracingulin (CGNL1, black squares). (C) Kymographs showing the effect of 5 mM methyl-β-cyclodextrin (MβCD; added 1 hour before analysis), reduced temperature (14°C), or ATP deletion (2 mM 2-D-deoxy-glucose, 1 mM 2,4-dinitrophenol, and 10 mM NaN3 for 1 hour before analysis). Bar, 5 μm. (D) Mobile fractions of cingulin (grey bars) and paracingulin (black bars) from conditions in panel C. (E, F) Single image and kymograph after photobleaching of GFP-CGN (E) and YFP-CGNL1 (F) over an elongated junctional region. Recovery at the center or edges of the bleached region occurred at similar rates. Bar, 5 μm. (G) Model of cingulin and paracingulin behaviour, illustrating how 96% of cingulin and paracingulin is in a mobile fraction, that exchanges between junction-associated (36%) and cytoplasmic (60%) pools.
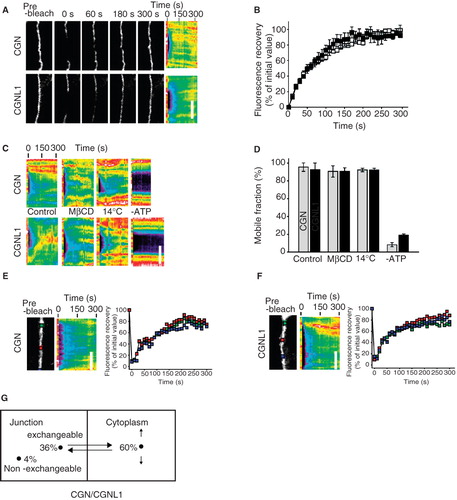
Figure 2. Cingulin and paracingulin show distinct localizations in isolated MDCK cells. (A–F) : Still images (from time-lapse movies) of cells expressing either YFP-CGNL1 (A–C) (A, B from Movie n. 1 ; C from Movie n. 2, see Supplementary Material, available online), or GFP-CGN (D-F) (D, E from Movie n.3, F from Movie n. 4, see Supplementary Material, online). Arrows indicate localization of proteins at the peripheral borders of isolated cells. Square brackets (B, D, E) indicate leading edges of migrating cells. Arrowheads (C, F) indicate cytoplasmic dots. « n » (A, B, D, E, F) indicates the nucleus. « c » (C, D) indicates diffuse cytoplasmic labelling. Asterisks (D, E) indicate cytoplasmic perinuclear labelling. (G–I): Double immunofluorescent labelling of fixed MDCK cells with rabbit anti-paracingulin antibodies (G, H, I), and either mouse monoclonal anti-cingulin (G'), or mouse monoclonal anti ZO-1 (H'), or mouse monoclonal anti E-cadherin (I'). Arrows (G–H) indicate cell periphery labelled by anti-paracingulin but not by either anti-CGN or anti-ZO-1 antibodies. Arrowhead (H) indicates labelling for ZO-1 in a short segment of the cell periphery). Arrow (I) indicates colocalization between accumulated paracingulin and E-cadherin along the cell periphery. Bar = 10 μm.
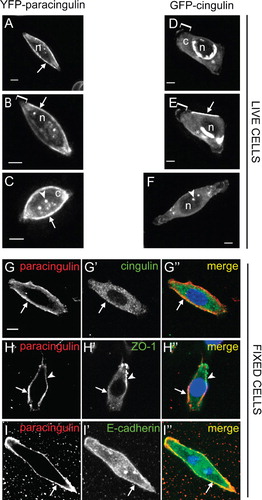
Figure 3. Dynamic localization of cingulin and paracingulin in dividing MDCK cells. Captured still frames from time-lapse movies of isolated MDCK cells expressing either GFP-CGN (A–D from Movie n. 3, J–M from Movie n. 5, N–O from Movie n. 6, see Supplementary Material, available online) or YFP-CGNL1 (E to I, from Movie n. 2, see Supplementary Material). Arrows indicate the periphery of the cells, except in N and O, where they indicate the junction formed between migrating cells. Arrowheads indicate either labelling at the cleavage furrow (B, C, F, H), or the distal edges of newly formed cell-cell contacts (D, I, L, M, N, O). Asterisks (D, I, M) indicate the central region of newly formed junctional contacts. The time in minutes (‘) and hours (h) is indicated in the upper right-hand corner of each panel, starting arbitrarily from time 0 for the first image. Bar = 10 μm.
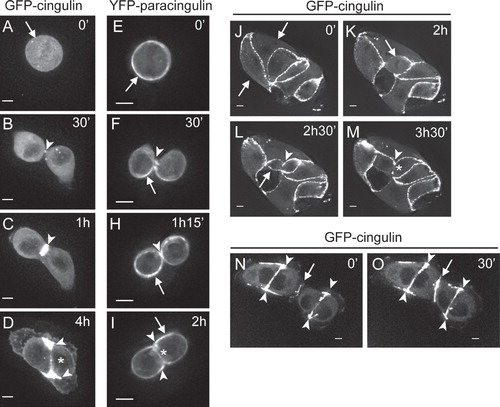
Figure 4. Paracingulin and E-cadherin, but not cingulin and ZO-1 require the integrity of the microtubule cytoskeleton for their stable association with junctions. Immunofluorescent localization of paracingulin, cingulin, ZO-1, E-cadherin, actin and α-tubulin in control MDCK cells (control), in cells treated with latrunculin B (+Latr.B), and in cells treated with nocodazole (+Nocodazole). Arrows and arrowheads indicate labelling that is either fragmented or reduced or disrupted (see text of results). Asterisks indicate normal labelling, not affected by the drug treatment. Note that only for cingulin/paracingulin labelling the images correspond to double-labelled cells. Neither treatment with latrunculin B nor nocodazole modified the levels of expression of cingulin and paracingulin (data not shown). Bar = 10 μm.
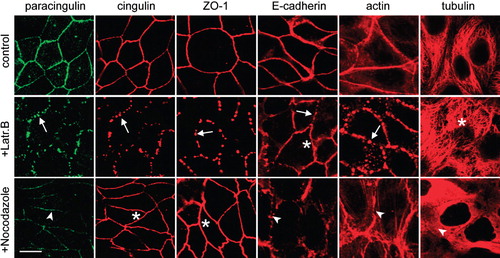
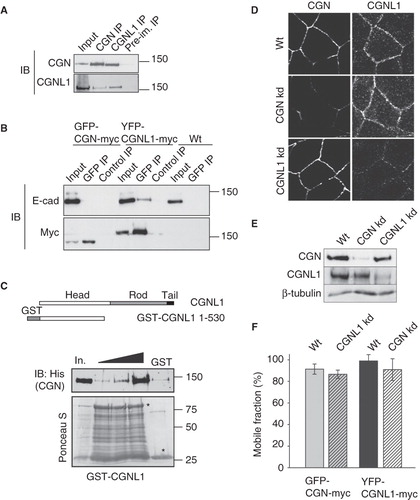
Figure 5. Cingulin and paracingulin form a complex together, but are independently recruited to junctions. (A) Paracingulin and cingulin form a complex. Immunoblot analysis, with antibodies against cingulin and paracingulin of immunoprecipitates prepared from kidney epithelial cell lysates, using antibodies against cingulin and paracingulin, and a rabbit preimmune serum. Input = 1/10 of the volume of lysate used for the immunoprecipitation. (B) Paracingulin and E-cadherin form a complex. Immunoblot analysis, with anti-E-cadherin and anti-myc antibodies of lysates (Input) and immunoprecipitates obtained using either anti-GFP (GFP) or control antibodies on lysates of MDCK cells expressing either GFP-CGN-myc or YFP-CGNL1-myc or GFP (as control) proteins, or on lysates of normal control cells that do not express any exogenous protein (wt). Control immunoprecipitations (control IP) were carried out with an unrelated monoclonal antibody (anti-HA). (C) Above, schematic diagram of the domain organization of paracingulin, and the bait GST fusion protein (GST-CGNL1 residues 1-530) used for the pulldown experiment shown below. Below, immunoblot analysis, using anti-His antibodies, of GST pulldowns where a fixed amount of bait protein was incubated with increasing amounts (50, 100, 250 μl) of insect cell lysate containing full-length, His-tagged CGN. Note that very little CGN was pulled down by the control GST protein (using 100 μl of insect cell lysate). In. = input (3.5 μl lysate). Ponceau-S staining shows the amounts of GST fusion protein and GST (asterisks) in the pulldown. (D) and (E) Immunofluorescence (D) and immunoblotting (E) analysis of cingulin (CGN) and paracingulin (CGNL1) in wild-type cells (wt) and in depleted lines (CGN kd, CGNL1 kd) (Guillemot and Citi Citation2006a, Guillemot et al. Citation2008a). Bar = 10 μm. (F) Mobile fractions (determined by FRAP analysis) of either GFP-CGN or YFP-CGNL1, carried out either in wild-type cells (left bar) or paracingulin-depleted cells (for GFP-CGN) or cingulin-depleted cells (for YFP-CGNL1) (right bar). The differences in the mobile fractions are not statistically significant.