Figures & data
Figure 1. Modelling the pathways for lysosomal delivery of newly-synthesized LAMP-1. Newly-synthesized (labelled) LAMP-1 (LAMP-1*) enters a steady-state pool of existing LAMP-1 (pool size n1) at a rate S. From n1 it equilibrates by membrane traffic to a second pool, n2. The curves indicate the time course for the respective accumulation of LAMP-1* in pools n1 and n2 as well as in the combined endocytic pathway (EP = n1 + n2). In panel A, input is via early endosomes (n1 = eEn), followed by exchange with n2 as representing lysosomes (n2 = Ly). In panel B, input occurs directly into lysosomes, with n1 = Ly and n2 = eEn. The simulation is based on the assumption that at steady state the bulk of LAMP-1 resides in lysosomes (here taken as 90%). (The curves are an approximation because the input function S has been treated as a first-order process, S = Stotal · [1-e-λ·t], as indicated by the curves for (n1 + n2). This approximation allows for algebraic integration of the underlying differential equations. The more realistic input by sigmoidal characteristics cannot be integrated algebraically. The approximation resulted in the absence of a lag phase at early times as observed experimentally in this study, ).
![Figure 1. Modelling the pathways for lysosomal delivery of newly-synthesized LAMP-1. Newly-synthesized (labelled) LAMP-1 (LAMP-1*) enters a steady-state pool of existing LAMP-1 (pool size n1) at a rate S. From n1 it equilibrates by membrane traffic to a second pool, n2. The curves indicate the time course for the respective accumulation of LAMP-1* in pools n1 and n2 as well as in the combined endocytic pathway (EP = n1 + n2). In panel A, input is via early endosomes (n1 = eEn), followed by exchange with n2 as representing lysosomes (n2 = Ly). In panel B, input occurs directly into lysosomes, with n1 = Ly and n2 = eEn. The simulation is based on the assumption that at steady state the bulk of LAMP-1 resides in lysosomes (here taken as 90%). (The curves are an approximation because the input function S has been treated as a first-order process, S = Stotal · [1-e-λ·t], as indicated by the curves for (n1 + n2). This approximation allows for algebraic integration of the underlying differential equations. The more realistic input by sigmoidal characteristics cannot be integrated algebraically. The approximation resulted in the absence of a lag phase at early times as observed experimentally in this study, Figure 8).](/cms/asset/6d8ecb3b-3327-4b02-b078-df272b1d9ba6/imbc_a_572567_f0001_b.jpg)
Figure 2. Quantification of immunoprecipitated 35S-LAMP-1 using Instant Imager scanning software versus liquid scintillation counting. (A) P388D1 cells were metabolically labelled with 35S-methionine at 10-7 M (specific-activity = 1175 Ci/mmol) for 2 h. Soluble 35S-LAMP-1 was immunoprecipitated from 200 μl soluble cell extract (10·10-6 cells) with 10 μl ID4B-containing, 50-fold concentrated TCM and the indicated protein-G bead volumes. Eluents were subjected to SDS-PAGE, followed by autoradiography for 64 h. The immunoprecipitated 35S-LAMP-1 was quantified by digital analysis using Instant Imager software. The radio-activity profile of lane 5 was aligned to the lane by eye (box at right). (B) LAMP-1 bands were excised relative to MW markers, as indicated, dissolved in 2 ml 30% H2O2 overnight at 60°C and quantified by scintillation counting in a scintillation counter. The counts obtained from the scintillation counter correlated linearly (slope of 268) with the counts obtained from the Instant Imager detection method.
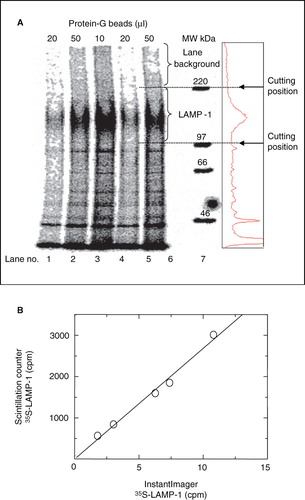
Figure 3. Optimization of the cell-concentration range to be used for the quantitative immunoprecipitation of LAMP-1. 35S-LAMP-1 was immunoprecipitated from a detergent-soluble fraction of cell lysate (160 μl) at increasing concentrations (1 unit of LAMP-1 was as obtained from 106 cells), with ID4B (2 μl of 50-fold concentrated TCM) and protein-G beads (50 μl). Error bars (where larger than symbol) indicate variation between duplicate samples from the same experiment. Different symbols refer to independent experiments. The curve shows Michaelis-Menton kinetics with a Km = 10.63 units/ml.
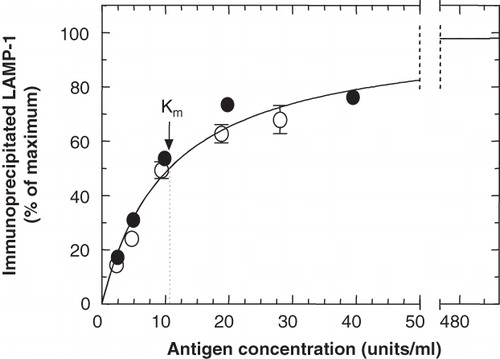
Figure 4. Maximal crosslinking of LAMP-1 in the endocytic pathway. P388D1 cells were starved in serum-free and methionine-free medium for 30 min and metabolically labelled with 35S-methionine for 1 h, followed by a chase to maturation for 1 h in the presence of unlabelled methionine. Subsequently, HRP (3 mg/ml) was endocytosed for the indicated times, when samples were taken and cooled on ice. Samples were split into two fractions, one of which was treated for HRP-DAB crosslinking. The other fraction served as a measure for total 35S-LAMP-1. In both fractions, the soluble (non-crosslinked) 35S-LAMP-1 was quantified by scintillation counting of the appropriate band after SDS-PAGE of the immunoprecipitated soluble LAMP-1. The degree of 35S-LAMP-1 crosslinking was obtained by expressing the complementary LAMP-1 that remained soluble as a fraction of the total 35S-LAMP-1 in each sample. A curve was fitted manually. Close to maximum levels were reached after 100 min with a maximum crosslinking of 76% after about 150 min.
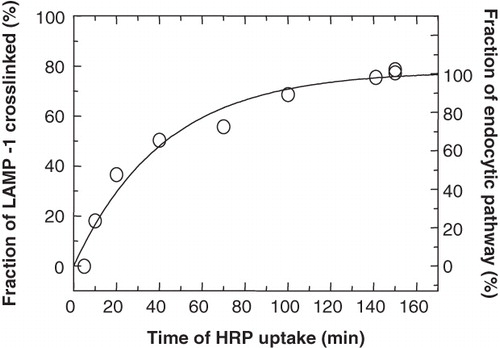
Figure 5. The effect of HRP concentration in a 30-min pulse on the crosslinking of LAMP-1 in lysosomes. P388D1 cells were starved for 15 min in serum-free and methionine-free medium. 35S-methionine was added, the cell suspension split into 5 aliquots and cells were metabolically labelled at 37°C for 1.5 h. HRP was internalized at the indicated concentrations during the last 30 min of the labelling period. The internalized HRP was chased to lysosomes for a further 2.5 h (total duration of a crosslinking experiment was ∼3 h). Aliquots were split into two fractions, one of which was treated for HRP-DAB crosslinking. Samples were analysed for the degree of crosslinking, as described in . Symbols refer to duplicate immunoprecipitations of individual samples within the same experiment.
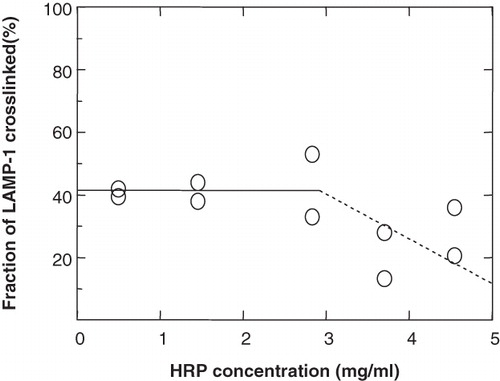
Figure 6. Characterization of crosslinked early endosomes by EEA1 and Rab5b. Early endosomes (eEn; 5 min HRP pulse) or lysosomes (Ly; 30 min HRP pulse, 70 min chase) were filled with HRP, crosslinked and collected as brown bands from the low-density or high-density fractions of a 27% Percoll gradient, respectively, as was previously determined with organellar markers (Haylett and Thilo Citation1986). Crosslinked organelles were then separated from non-crosslinked membranes through precipitation by low-speed centrifugation. Peripheral proteins were solubilized, subjected to SDS-PAGE and Western blotting. Rab5b was separated on a 13% gel and identified with primary rabbit polyclonal anti-human Rab5b antibody (2 μg/ml). EEA1 was separated on a 7% gel and identified with rabbit polyclonal primary antibody against mouse EEA1 (2 μg/ml). Detection was via a peroxidase-labelled anti-rabbit secondary antibody. Early endosomes were positive for EEA1 and Rab5b. Section A: Non-crosslinked, soluble, HRP-free membranes as from top (eEn and PM) or bottom (Ly) fractions of the Percoll density-gradient. Sections (B) and (C): Crosslinked organelles only, with HRP-free organelles removed. Crosslinked organelles that resulted from a 5-min HRP-pulse stained positive for both early endosomal markers (bands iii and v).
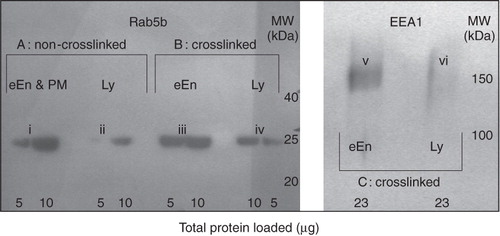
Figure 7. Biosynthetic processing of immunoprecipitable 35S-LAMP-1. P388D1 cells were starved in methionine-free medium for 30 min at 37°C. At time zero, 35S-methionine was added at 10-7 M (specific activity = 1175 Ci/mmole) and cells were labelled for 5 min. 35S-LAMP-1 was then chased for the indicated time, immunoprecipitated, processed via SDS-PAGE and quantitated by scintillation counting. The data were obtained by combining the values for total newly-synthesized soluble immunoprecipitable 35S-LAMP-1 as from all non-crosslinked fractions of the kinetic experiments to follow. Since all experiments did not extend across the entire time-course, data from individual experiments were normalized to a best-fit steady state that started at approximately 60 min and averaged around 1000 dpm. The average from the different experiments is shown. Vertical error bars indicate variation (SEM) among the data obtained in the time intervals indicated by the horizontal bars. The first-order curve, fitted to the data with the background as a free parameter, indicated a half-time of 14 min for the processing of LAMP-1 into immunoprecipitable full-length protein.
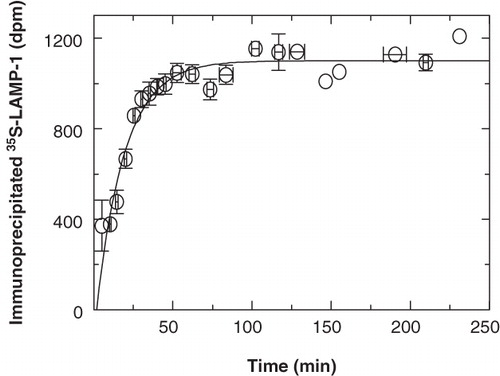
Figure 8. Delivery of newly-synthesized 35S-LAMP-1 into endocytic organelles. (A) The entire endocytic pathway. The endocytic pathway of P388D1 cells was filled with HRP (70 min). In the continued presence of HRP, cells were starved in serum-free and methionine-free medium (30 min) and then metabolically labelled with 35S-methionine for 5 min at time zero. In total, HRP was endocytosed for 100 min before metabolic labelling was performed. This was followed by further incubation in the presence of unlabelled methionine and HRP for the indicated times, when samples were taken and cooled on ice. One half of each sample was treated for HRP-mediated DAB crosslinking. The other half served to measure total immunoprecipitable 35S-LAMP-1. In both aliquots, soluble 35S-LAMP-1 was quantified by scintillation counting of the appropriate band after SDS-PAGE of immunoprecipitated LAMP-1. Delivery of 35S-LAMP-1 into the endocytic pathway was expressed as the amount of crosslinked 35S-LAMP-1, as a fraction of the total 35S-LAMP-1. The average from six independent experiments is shown. Vertical error bars indicate variation (SEM) among the data obtained from different experiments as grouped in the time intervals indicated by the horizontal bars. The curve was fitted manually. 67% of 35S-LAMP-1 was crosslinked at steady state. As indicated by the ordinate at the right, this value was normalized to represent a steady state of 100% LAMP-1 in the endocytic pathway. (B) Lysosomes. An HRP-uptake pulse (30 min) was chased into lysosomes for 70 min. This was equivalent to a total time for HRP delivery of 100 min before metabolic labelling. Cells were starved in serum-free and methionine-free medium during the last 30 min of the HRP-chase and then labelled with 35S-methionine for 5 min. This was followed by further incubation in the presence of unlabelled methionine, but absence of HRP for the indicated times. Samples were processed and data analysed as in (A). The fraction of total 35S-LAMP-1 crosslinked in lysosomes at steady state was ∼39%. The ordinate at the right indicates the fraction of crosslinked LAMP-1 as a percentage of maximal crosslinking in the endocytic pathway (i.e., 58%). (C) Early endosomes. Cells were starved and metabolically labelled as in (A). HRP was only added during the last 5 min of each time point. Samples were processed and data were analysed as described in (A). The fraction of crosslinked 35S-LAMP-1 reached a maximum of about 25% after 30 min and then levelled off to a steady state of ∼ 6.8% that was equivalent to 10% of endocytic pathway LAMP-1, as indicated by the ordinate at the right. The data are compatible with a transient presence of LAMP-1 in early endosomes.
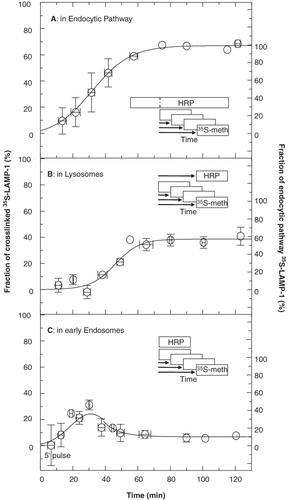
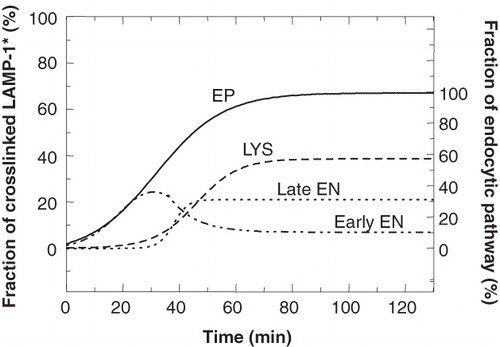
Figure 9. Comparison of the entry of 35S-LAMP-1 into individual compartments. The curves obtained for the experiments where 35S-LAMP-1 was crosslinked in the endocytic pathway (EP), lysosomes (LYS) and early endosomes (early EN) were used to calculate the curve for 35S-LAMP-1 entry into the late endosomes (late EN) by subtracting the sum of the early endosomal and lysosomal curves from that of the endocytic pathway. At steady state, the fraction of total 35S-LAMP-1 crosslinked in late endosomes was 21%. The ordinate at the right indicates the fraction of crosslinked LAMP-1 as a percentage of maximal crosslinking in the endocytic pathway, i.e., 32%. The congruence between the curves for early EN and the EP at early times (≤25 min) indicated that all LAMP entered via early EN.