Figures & data
Figure 1. Cytoskeletal effectors of Rho family GTPases. Schematic diagram representing the Rho family GTPases RhoA, Rac1 and Cdc42, their activities on major downstream effectors and targets, and their effects on cytoskeletal and junction organization. Green lines with arrows indicate activation, red lines with bar indicate inhibition, black lines with arrows indicate functional target/effect. Dia, diaphanous; ROCK, Rho kinase; PAK, p21-activated kinase; IQGAP, IQ motifs and GAP-related-domain containing protein; WAVE, WASP family Verprolin homologous protein; WASP, Wiskott-Aldrich syndrome protein; MLCK, myosin light chain kinase; MLCP, myosin light chain phosphatase; CRMP-2, Collapsin response mediator protein-2; LIMK, LIM domain kinase; CLIP-170, CAP-GLY domain containing linker protein; Arp, actin-related protein. See text for additional details. This Figure is reproduced in colour in Molecular Membrane Biology online.
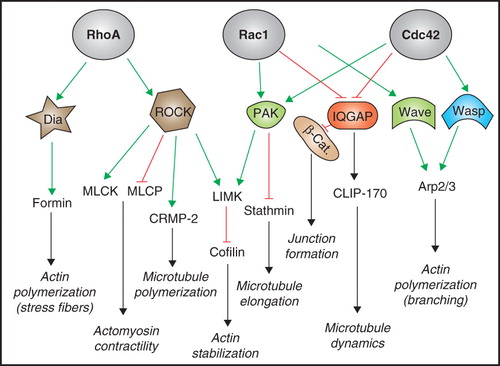
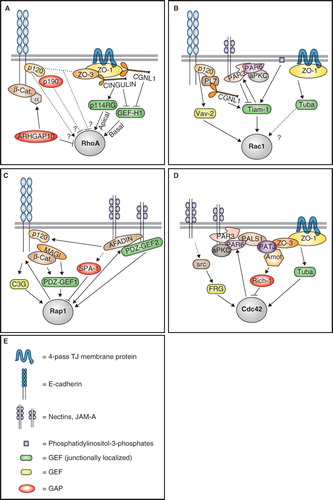
Figure 2. Regulation of small GTPases by junctional proteins. Schematic diagrams illustrating the major proteins and pathways involved in the regulation of RhoA (A), Rac1 (B), Rap1 (C), and Cdc42 (D) at junctions of mammalian epithelial cells. (E) is a graphic legend for panels A, B, C, D. Arrows indicate either physical/functional interaction, activation, or promotion of junctional recruitment. Lines with bar indicate inhibition. Dotted lines indicate indirect/unknown interaction. α = α-catenin; PL7 = PLEKHA7; p114RG = p114 RhoGEF; β-cat. = β-catenin. See text for additional details. This Figure is reproduced in colour in Molecular Membrane Biology online.