Figures & data
Figure 1. Wavenumber vs. temperature plot of RBC ghosts after incubation with egg-PC liposomes. Egg-PC treated RBCs (filled squares) have a higher cooperativity than non liposome treated RBCs (open circles).
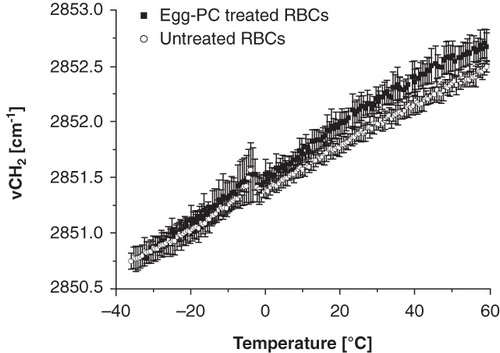
Figure 2. Wavenumber vs. temperature plot of egg-PC liposomes before (open circles) and after (filled squares) incubation with RBCs. The phase transition is visible as an abrupt increase in wavenumber and indicates a transition from gel-to-fluid phase. The tm is shifted 4.2°C after incubation with RBCs.
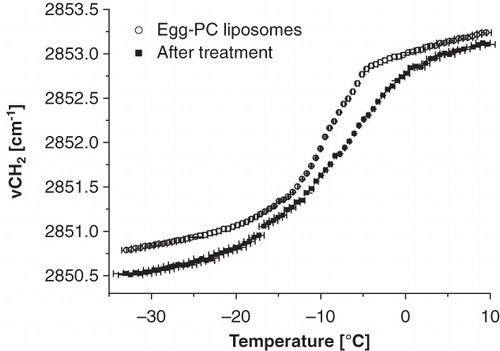
Figure 3. Membrane phase behaviour of RBCs (panel A–C) and liposomes from unsaturated lipids (panel D–F). The data points of panel A–C reflect νCH2 vs. temperature plots of non-liposome-treated RBCs (open circles) and liposome-treated RBCs (filled squares). Panel D–F show wavenumber vs. temperature plots of the liposomes before (open circles) and after incubation (filled circles) with red blood cells.
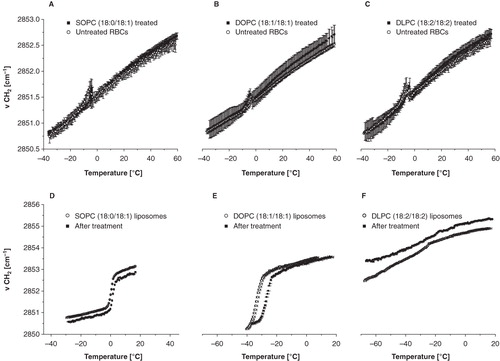
Figure 4. The phase transition temperature is indicating the transformation from gel-to-fluid state of a lipid layer. The lower the tm of the lipid the higher the shift in tm after incubation with RBCs.
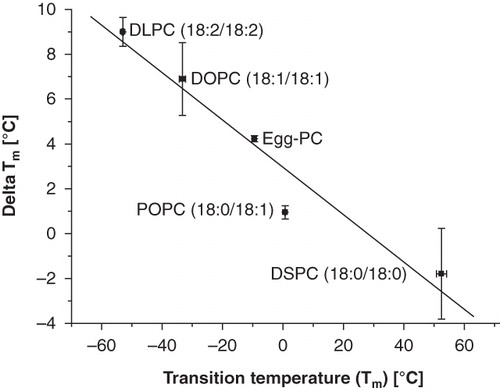
Figure 5. Variation of incubation time during RBC-liposome incubation. The slope of the wavenumber vs. temperature plots increases with incubation time.
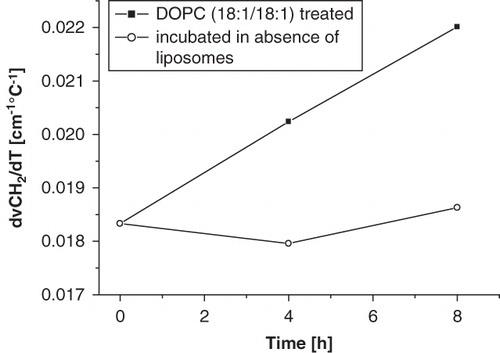
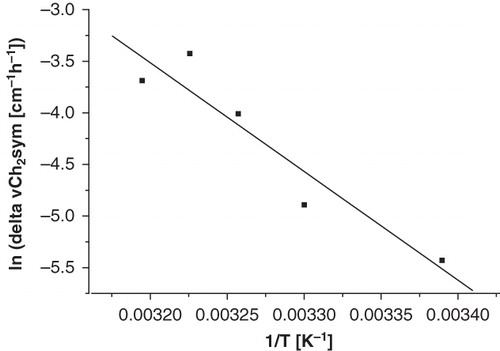
Figure 6. Effect of DOPC liposomes on RBC membranes after incubation at various temperatures. The data points reflect the increase in slope after 8-hour incubation in an Arrhenius plot.