Figures & data
Table I. Detergent properties. List and amounts of the eight detergents (D1–D8) used for protein purification. The detergents n-Dodecyl-β-D-maltopyranoside (DDM), n-Decyl-β-D-maltopyranoside (DM), n-Octyl-β-D-glucopyranoside (β-OG), n-Nonyl-β-D-glucopyranoside (NG), N-Dodecyl-N-N-dimethylamine-N-oxide (LDAO), CYMAL-5 (CY-5), Fos-choline-14 (FC-14) and ANAPOE-C12E8 (C12E8) are numbered D1–D8 in this study, respectively. The approximate critical micelle concentration (CMC) values were taken from Anatrace Inc.
Table II. Proteins used in this study. The 12 membrane proteins used in this study are denoted P1–P2. The ID refers to their gene names, and the corresponding Uniprot accession codes are provided. FLC refers to the molecular weight of the full-length construct including TEV cleavage site, GFP fusion and His-tag. CC is the molecular weight of the cleaved construct (full-length protein plus GSENLYFQ from the vector and cleavage site). The number of predicted transmembrane helices (TM) was calculated using TMHMM (Krogh et al. Citation2001).
Figure 1. High-throughput purification procedure. This schematic outlines the progress of 12 membrane proteins solubilized in DDM throughout the high throughput purification protocol. (a) Standard purification block representing the grid system: D1–D8 represent the eight different detergents used in rows A–H and proteins P1–P12 are confined to columns 1–12, respectively.
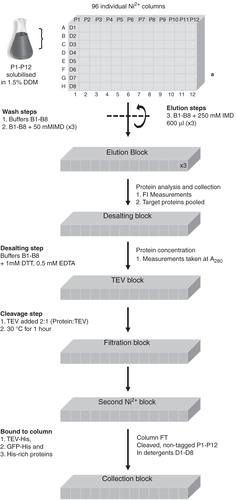
Figure 2. Protein detection using fluorescence. Membrane proteins P1–P12 in detergents D1–D8 were labelled with the fluorescent EZQ dye and visualized using an In Vivo Imaging System at excitation and emission energies of 465 and 620 nm, respectively. This Figure is reproduced in colour in the online version of Molecular Membrane Biology.
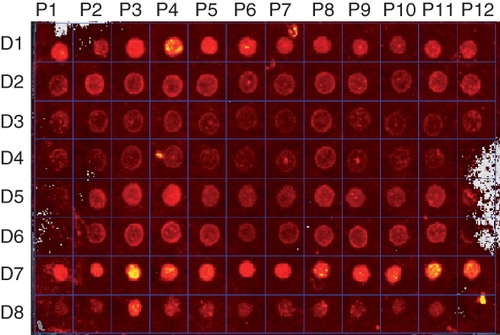
Figure 3. SDS-PAGE analysis of the purified proteins. This is a composite figure constructed using images from different gels, all aligned against the same molecular weight marker. Peak fractions taken after size-exclusion chromatography were incubated at 37°C for 30 min before being analyzed on an SDS-PAGE gel and stained with Coomasie Blue. All of the proteins migrated lower than expected for their predicted molecular weights, a phenomenon often observed for helical membrane proteins (Rath et al. Citation2009). Lane 1, molecular weight marker; Lanes 2–3, XylH; Lanes 4–5: PgpB and Lanes 6–7: YjdL. 4–12% Bis-Tris gels (Novex) were used and run in MOPS buffer, at 200 V for ∼ 50 min.
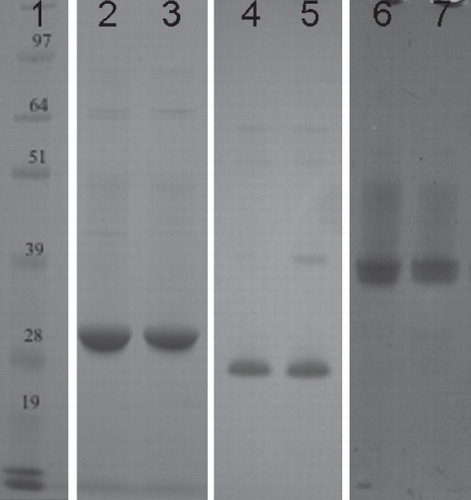
Figure 4. Size exclusion chromatography. Plots from size-exclusion chromatography, (a) PgpB is monodisperse in DDM, (b) YjdL is monodisperse in DDM, and (c) XylH is polydisperse in DDM (frey) and monodisperse in FC14. The void volume of the column was 7.7 ml. All absorbance data were normalized, by setting the maximum absorbance to 100 arbitrary units, using GraphPad Prism (Version 4.00 for Mac OSX, USA).
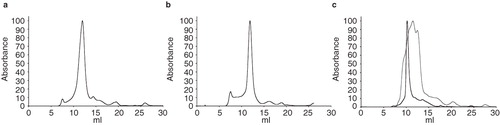
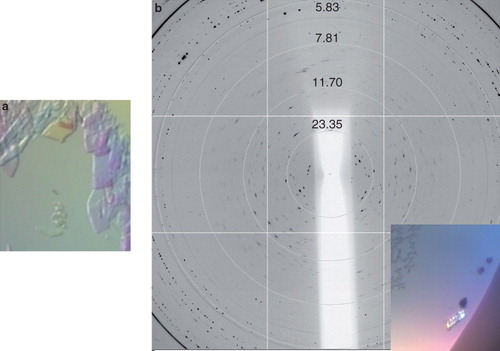
Figure 5. Crystals and diffraction patterns obtained from PgpB crystallization trials. (a) Initial crystals diffracted to around 15 Å, (b) Improved crystals diffracted anisotropically to approximately 4 Å. All diffraction images were collected on beamline I03 at Diamond Light Source using a wavelength of 0.9763 Å and an oscillation range of 1.0°. This Figure is reproduced in colour in the online version of Molecular Membrane Biology.
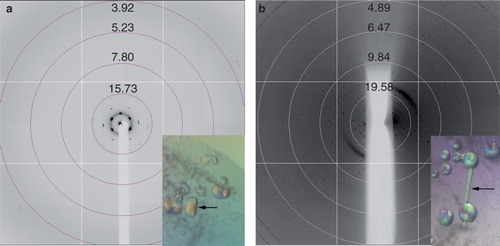
Figure 6. Crystals and diffraction patterns obtained from YjdL crystallization trials diffracting to ∼ 17 Å. Diffraction images were collected on beamline I02 at Diamond Light Source using a wavelength of 0.9796 Å and an oscillation range of 1.0°. This Figure is reproduced in colour in the online version of Molecular Membrane Biology.
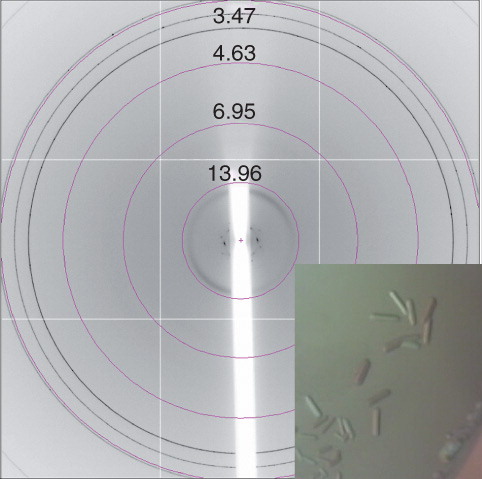
Figure 7. Xylh crystals and corresponding diffraction patterns. (a) Initial crystal which disappeared within 20 min, and (b) a cluster of crystals diffracting to approximately 7 Å. Diffraction images were collected on beamline I03 at Diamond Light Source using a wavelength of 0.9763 Å and an oscillation range of 1.0°. This Figure is reproduced in colour in the online version of Molecular Membrane Biology.