Figures & data
Figure 1. Alignment of primary sequences of orthologous ETR1 proteins from A. thaliana, P. patens subsp. patens and L. esculentum. Conserved amino acids in all three sequences are shaded in black, while a grey background indicates similar residues. The bold arrows indicate catalytic residues H353 and D659 in AtETR1, the dashed arrows show amino acids C65 and H69 that are involved in binding of a copper cofactor necessary for ethylene binding.
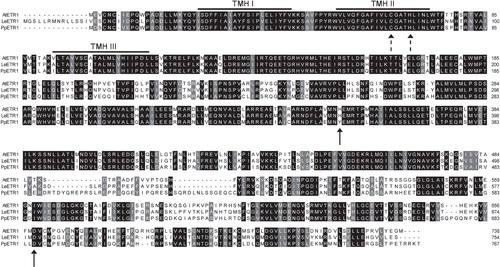
Figure 2. Effect of temperature on the expression of PpETR1 and LeETR1 in BL21 (DE3) at 30°C and 16°C. All cell cultures contained 1 mM IPTG. Equal amounts of cells from liquid cultures were analyzed by SDS-PAGE. Proteins were silver-stained (A) and receptor proteins were identified by Western blot analysis using antibodies directed against the deca His-tag (B). Protein bands representing the receptor proteins are framed by black boxes. Note that at 16°C expression temperature the protein band of receptor PpETR1 is overlayed by an endogenous protein of the bacterial host.
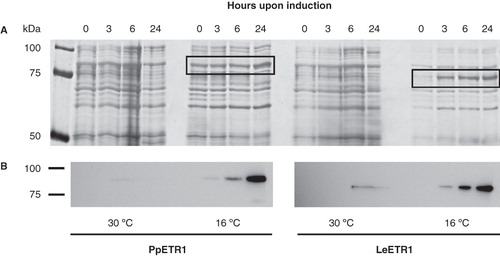
Figure 3. Solubilization efficiency of various ionic and non-ionic detergents used for extraction of AtETR1 from E. coli membranes. Supernatant fractions after centrifugation were analyzed by dot blot. Solubilized receptor proteins were monitored by antibodies directed against the hexa histidine tag. The following detergents were applied in the solubilization study: (1) Anapoe-20, (2) Anapoe-35, (3) Anapoe-58, (4) Anapoe-C10E6, (5) Anapoe-X-114, (6) Anapoe-X-405, (7) Anzergent 3-10, (8) Anzergent 3-12, (9) Anzergent 3-14, (10) C-Dodecafos, (11) Cyclofos-4, (12) Cyclofos-5, (13) Cyclofos-6, (14) Cyclofos-7, (15) Fos-Choline-9, (16) Fos-Choline-10, (17) Fos-Choline-11, (18) Fos-Choline-12, (19) Fos-Choline-13, (20) Fos-Choline-14, (21) n-octyl-β-d-glucopyranoside, (22) n-dodecyl-β-d-maltopyranoside, (23) n-octyl-β-d-thiomaltopyranoside, (24) no detergent.
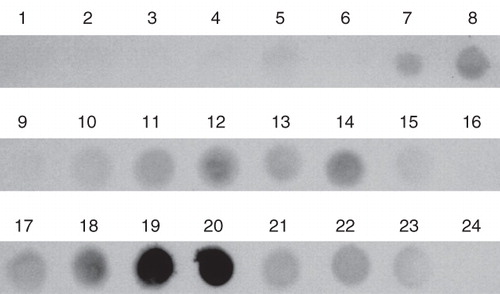
Figure 4. Solubilization efficiency of Fos-Choline-14 on recombinant AtETR1, PpETR1 and LeETR1. Supernatant and pellet fractions after solubilization and centrifugation were analyzed by dot blot. The receptor proteins were identified by immunostaining with an antibody directed against the deca His-tag.
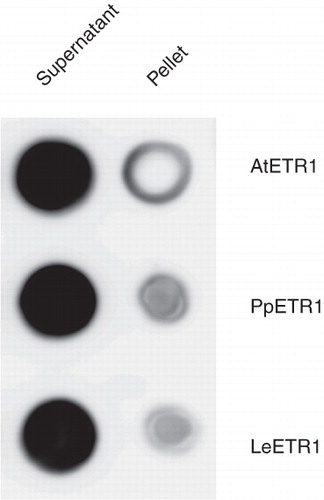
Figure 5. Purification of solubilized, His-tagged ethylene receptors AtETR1 (A), PpETR1 (B) and LeETR1 (C) by immobilized metal affinity chromatography. Samples from all purification steps were separated on 10% SDS-PAGE gels and proteins were visualized by silver-staining. Lane 1, supernatants after solubilization and centrifugation; lane 2, fractions of unbound protein after application to the affinity column; lane 3, washing fractions (no imidazole); lane 4, washing fractions with buffer supplied with 50 mM imidazole; lanes 5–7, elution fractions (lanes 5 and 6: 2 CV each, lane 7: 1 CV) containing ETR1 proteins (indicated by asterisk). Molecular weight markers: lane M A, Precision Plus Dual Color Protein Standards, Bio-Rad Laboratories (Munich, Germany); lane M B, PageRuler Plus Prestained Protein Ladder, Fermentas (St. Leon-Rot, Germany).
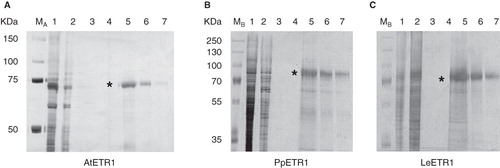
Figure 6. Western blot analysis of elution fractions from IMAC purification of AtETR1 (85 kDa), PpETR1 (89 kDa) and LeETR1 (87 kDa). The receptor proteins were identified by immunostaining with an antibody directed against the deca His-tag (A) and by an antibody directed against an epitope in the C-terminal domain of receptor AtETR1 (B) (Schaller et al. Citation1995). Signals were detected after 30 sec and 10 min (indicated by asterisk), respectively. Molecular weight marker: lane M, Precision Plus Dual Color Protein Standards.
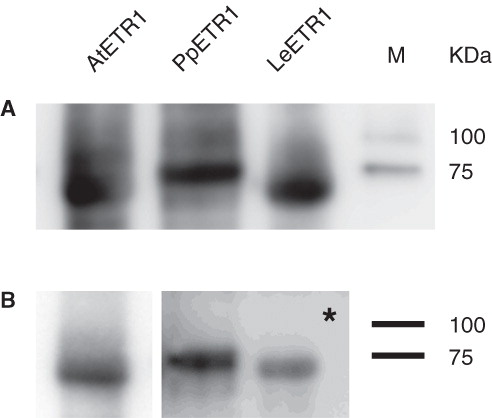
Figure 7. Autoradiography showing kinase activity of purified receptors AtETR1, PpETR1 and LeETR1. The receptor proteins were detected by Ponceau S staining (A) and incorporation of 32P (B). Molecular weight marker: lane M, Precision Plus Dual Color Protein Standards.
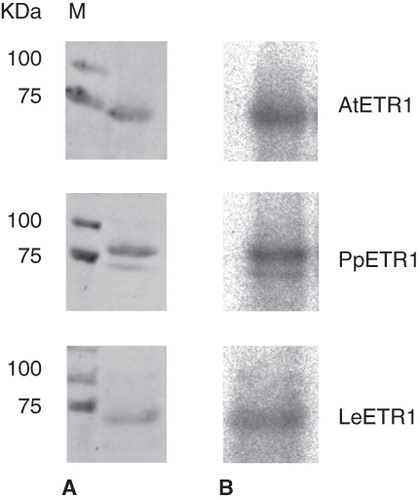
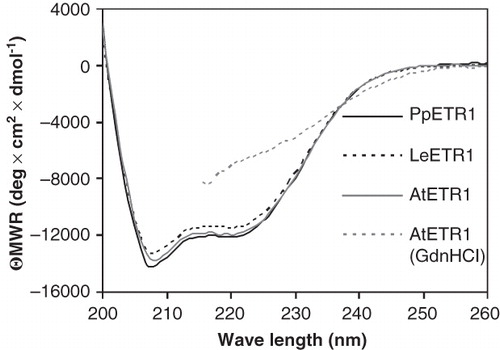
Figure 8. Far-UV CD spectra of purified AtETR1, PpETR1 and LeETR1. Mean residue weight ellipticity was calculated from collected data taking into account the molecular weight and the protein concentration to allow for comparison of individual spectra. Data of AtETR1 treated with 4 M guanidinium hydrochloride indicate that the receptor is unfolded in the presence of the chemical denaturant. Due to high absorption of the denaturant no data were collected below 215 nm.