Figures & data
Figure 1. Iron nutrition tests with L. monocytogenes EGD-e. Bacteria were grown in BHI broth, rendered iron-deficient with 1 mM bipyridyl, and plated on BHI agar containing bipyridyl (Newton et al. Citation2005). Iron-complexes were applied to the paper discs. EGD-e used siderophores Fc, FcA and FxB [250 uM (discs 1, 4, 7, respectively) 50 uM (discs 2, 5, 8) and 5 uM (discs 3, 6, 9), holoTf and holoLf (discs 10, 11; 6 uM), Hb (disc 13; 15 uM) and Hn (disc 14; 100 uM). Utilization of iron from Ftn (disc 12; 2 uM) and ferric enterobactin (discs 16–18) was not observed here, but seen in other tests (Jin et al. Citation2005, Newton et al. Citation2005). This Figure is reproduced in color in the online version of Molecular Membrane Biology.
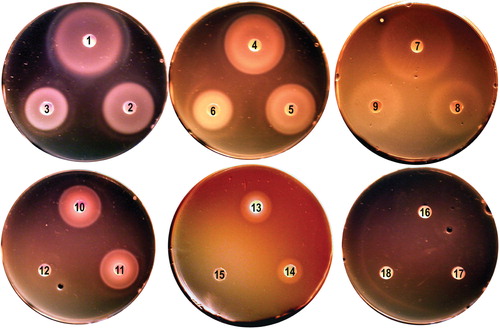
Table I. Affinities of eukaryotic binding proteins and siderophores for iron (III).
Figure 2. Models of PG structure. Left: In (A) the layered model (Holtje Citation1998) predicts oligosaccharide chains perpendicular to the long axis of the bacterial cell and (B) parallel to the cell surface (reprinted with permission from Holtje Citation1998). (C) Cryotomography of purified, frozen-hydrated Gram-negative bacterial (Caulobacter crescentus) sacculi (reprinted with permission from Gan et al. Citation2008). The image represents a 10-nm thick Z-slice through the 3-D reconstruction of a purified sacculus. The inset shows enhanded magnification to show glycan moieties (gl). Right (images reprinted with permission from Meroueh et al. Citation2006): the vertical scaffold model (48, 100), showing the NMR-determined structure of a glycan chain and attached oligopeptide side chains (D), that lead to a hexagonal polymerization (E), creating cells of defined size through the cell wall (F) when the polymer assembles with the NAGNAM chains perpendicular to the cell surface (G). This Figure is reproduced in color in the online version of Molecular Membrane Biology.
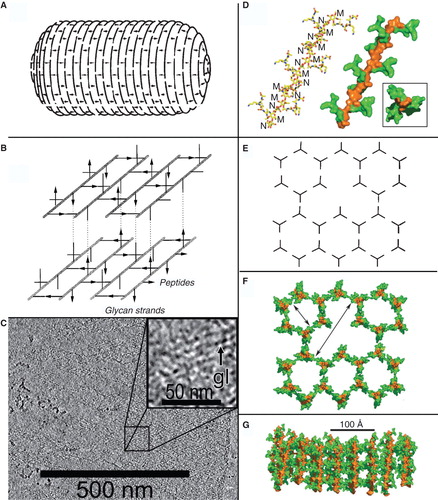
Figure 3. Space-filling depiction of the PG matrix in the vertical scaffold model. The image in was rotated to show the honeycombed PG polymer (brown) from the cell exterior (100). The pores (20–50 Å) of the polymer allow permeation of small molecules like ferric siderophores and Hn, which the lipoprotein binding proteins of ABC transporters adsorb for uptake. Note the similarity to the arrangement of glycans in the cryotomographic section shown in . This Figure is reproduced in color in the online version of Molecular Membrane Biology.
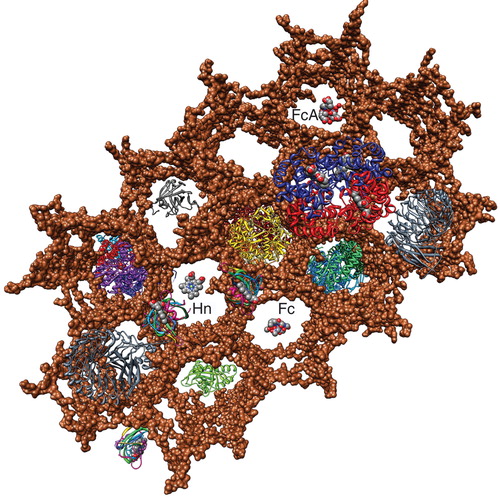
Figure 4. High resolution AFM image of the staphylococcal cell wall. The image shows a network of fibers with large empty spaces. Bar = 50 nm. Reprinted with permission from Touhami et al. (Citation2004).
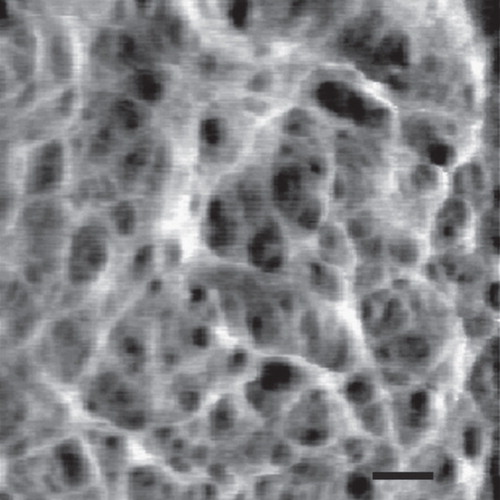
Table II. Thermodynamic and kinetic parameters of ferric siderophore and Hn transport in L. monocytogenes. Binding KD (nM) and capacity (Cap; pMol/109 cells), and transport KM (nM) and Vmax were determined from studies with [59Fe]-Hn.
Figure 5. Model of the listerial PG, based on the vertical scaffold model. A schematic drawing of the listerial cell wall, from the crystallographic coordinates of homologous constituents, shows the direct permeation of ferric siderophores (Fc; ferrichrome) and Hn to CM ABC-transporters (red arrows), and sortase-dependent uptake of Hn from Hb through PG-anchored binding proteins (blue arrows). This Figure is reproduced in color in the online version of Molecular Membrane Biology.
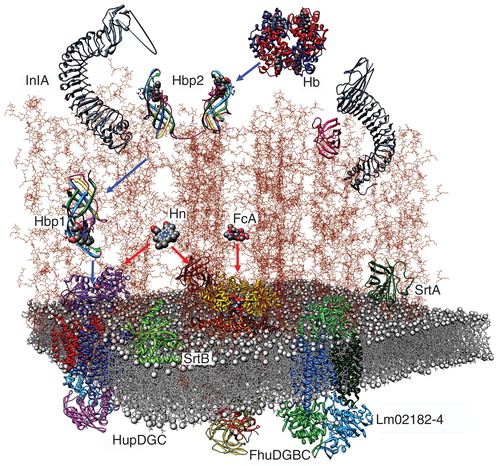
Figure 6. Hn/Hb binding proteins of Gram (+) bacteria. (A) The srtB region of the L. monocytogenes chromosome contains proteins with either sortaseB (purple loci) and sortaseA (light purple loci) recognition sites. (B) The full-length sequences of IsdA (354 aa), B (645 aa), C (227 aa) and H (895 aa) of S. aureus show homology to Hbp1 (207aa) and Hbp2 (569 aa) of L. monocytogenes. In a CLUSTALW comparison, the ∼ 125 residue NEAT domains (boxed regions) of IsdA, C, Hbp1 and the two NEAT-domains of IsdB or Hbp2 are aligned (once or more) to the three predicted NEAT-domains of IsdH (highlighted green). (C) Homology in NEAT3 of IsdH. Identical amino acids are highlighted blue; black stars mark identity between IsdB and H; red stars mark identity between IsdA or C and Hbp1 or 2; white stars mark identity between IsdB or H and IsdA or C or Hbp1 or 2. NEAT domains of IsdA, C and NEAT3 of IsdH were crystallographically solved, allowing denotation of their secondary structures (8 β-strands and 1 short α-helix; boxed in colors); Hn-contact residues (and identical a.a in other proteins) are highlighted yellow. IsdB (NEAT2) and H (NEAT3) are 58% identical; IsdA, C, Hbp1, 2 and IsdH (NEAT3) are 49% identical. This Figure is reproduced in color in the online version of Molecular Membrane Biology.
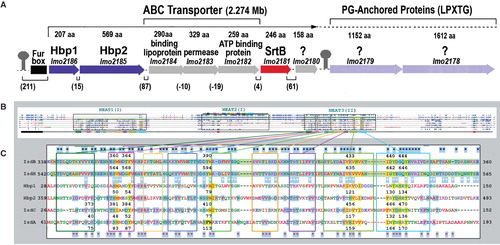
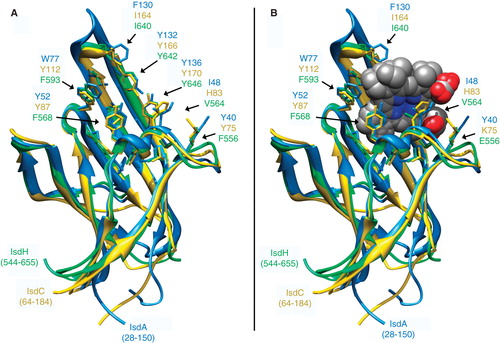
Figure 7. Structure of NEAT-domains. Three protein domains (IsdA, isdC, IsdH are blue, yellow and green, respectively), aligned by the MATCH algorithm of CHIMERA (UCSF), are illustrated in ribbon format with ligand contact residues (noted in ) displayed in stick form, in the absence (A) and presence (B) of Hn. This Figure is reproduced in color in the online version of Molecular Membrane Biology.