Figures & data
Figure 1. (A) Graphical representation of the four constructs. (B) Sequence comparison of the loop deletion region of the relevant constructs with the rat ortholog GLRA1_RAT. (C) Outline of the N-terminus of constructs 2–4; construct 1 is not listed, as a mixture of sequences was observed. It should be noted that all constructs except construct 4 possess N-terminal heterogeneity. The identified cleavage sites are marked with a ↓ and the given numbers correspond to the native GlyR protein sequence (isoform b, P23415-2). This Figure is reproduced in color in Molecular Membrane Biology online.
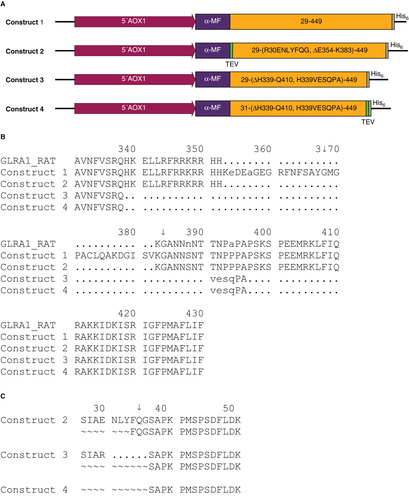
Table I. Representation of all constructs generated during this work. They differ in the position of the TEV cleavage site, length of loop 2, N-terminal and C-terminal tags, N-terminal modifications, P. pastoris strains and expression vectors. Only the first four constructs are discussed as those predominantly contribute to the outcome of this work.
Table II. Characteristics of the main gel filtration peak and melting temperatures of the individual constructs in complex with agonist and antagonist, respectively.
Figure 2. (A) SDS-PAGE of purified GlyR. The second lane displays construct 1 with a distinct band for GlyR between the marker at 38 and 49 kDa and significant degradation products at 38 and 7 kDa. Construct 2 shows a significant reduction of degradation products visualized by a faint band at 38 kDa in addition to the dominant band between the marker at 38 and 49 kDa (lane 3). The last two lanes represent construct 3 and 4, where only a single band characteristic for GlyR is observed. (B) Blue-Native PAGE of construct 2–4. For construct 2 (lane 2), several equally strong bands at higher molecular weights were observed indicating protein aggregation. The other two constructs (lane 3, 4) solely show a strong band between 242 and 480 kDa, characteristic for the pentameric complex.
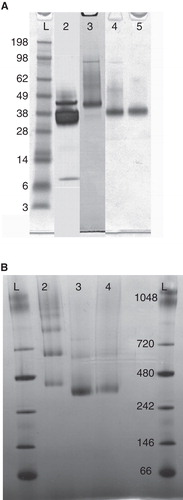
Figure 3. Gel filtration profile of GlyR expressed using construct 2, 3 and 4 using a superdex 200 10/300 GL gelfiltration column. For better visualization, the curves were normalized prior plotting. This Figure is reproduced in color in Molecular Membrane Biology online.
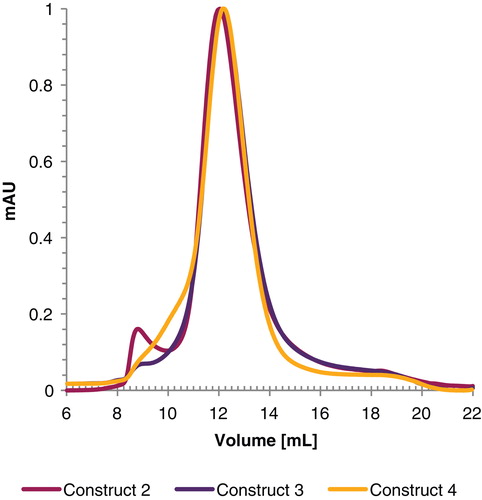
Figure 4. Thermal denaturation curves of (A) construct 2 and (B) construct 4. The traces are outlined using the following color scheme: GlyR (purple), in complex with 10 μM strychnine (blue) and 4.5 mM glycine (yellow). Data were continuously recorded using a Jasco J-715 spectropolarimeter at 220 nm in the temperature range from 25–95°C at 1°C/min intervals and a protein concentration of 0.5 mg/ml. The constructs exhibit a clear temperature shift upon addition of strychnine. This Figure is reproduced in color in Molecular Membrane Biology online.
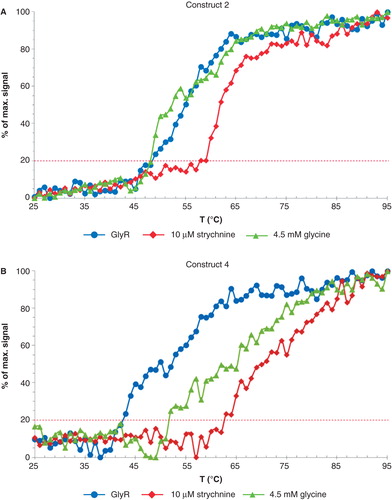
Figure 5. Graphical representation of protein stability. In (A) construct 2 and (B) construct 3 are monitored over a period of seven days in the presence (right) and absence (left) of 10 μM strychnine. The curves are presented as follows: day 1 (purple), day 2 (blue), day 3 (yellow), day 4 (green), day 5 (light blue), day 6 (grey) and day 7 (purple, dashed line). Absorption at 1 ml elution volume was set to zero for all individual chromatograms. This Figure is reproduced in color in Molecular Membrane Biology online.
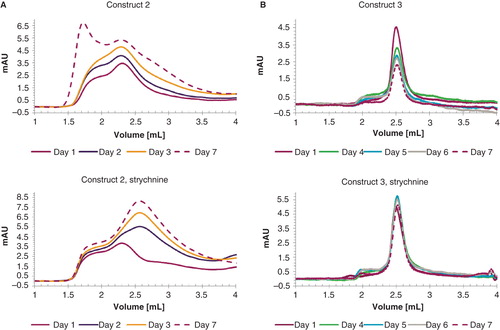
Table III. Ligand titrations into purified GlyR (construct 2).
Figure 6. Visualization of the buffer mismatch that appears when aliquots of buffer containing a defined DDM concentration (0.1–0.3%) is titrated into 20 mM Bis Tris-propane pH 7.4, 200 mM KCl, 0.0125 mg/ml lipids and 0.2% DDM. A negligible mismatch is only observed at 0.22% and 0.24% detergent. To avoid curve overlap, the graphs were horizontally shifted. This Figure is reproduced in color in Molecular Membrane Biology online.
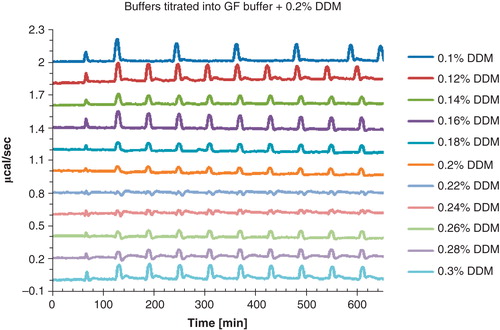
Figure 7. ITC titrations of (A) 300 μM strychnine and (B) 800 μM glycine into purified GlyR (construct 2). In (C) a displacement experiment of 300 μM strychnine titrated into purified GlyR (construct 2) containing a saturating glycine concentration is shown. The upper panel represents the ITC thermogram, whereas the lower panel corresponds to the fitted binding isotherms. The measurements were conducted at 20°C with a protein concentration of 17.5 μM.
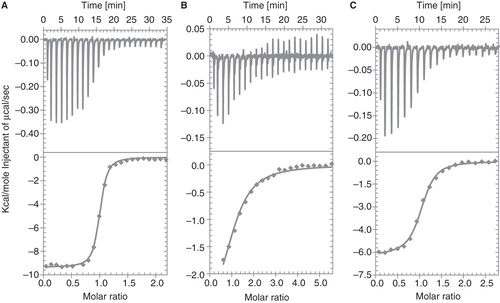
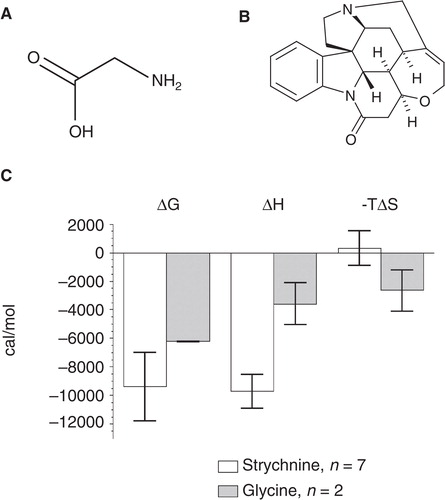
Figure 8. The chemical structures of (A) glycine and (B) strychnine are shown. (C) Thermodynamic parameters of strychnine and glycine binding to GlyR (data from ). Strychnine titration is determined by an enthalpic contribution while the interaction of glycine is driven by a large entropic contribution to ΔG.