Figures & data
Figure 1. Development of model membrane systems. This Figure is reproduced in colour in the online version of Molecular Membrane Biology.
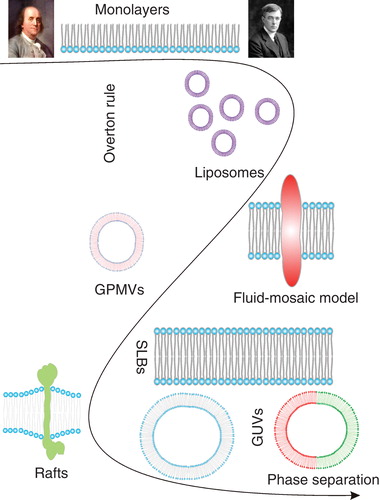
Figure 2. Membrane features involved in protein-lipid interactions. (A) Lipid composition as determined by Mass Spectrometry. Lipid composition of MDCK cells varies during epithelial polarization. Individual lipid species can be quantified and have unique polarization-dependent behaviors (modified from Sampaio et al. Citation2011). (B) C-Laurdan spectra report cell-dependent membrane packing of plasma membranes (see Giant Plasma Membrane Vesicles) derived from different cell types. GP calculated as in Equation (1). (C) Membrane lateral pressure. Positive pressure at the head groups (1) and acyl chains (3) is balanced by lateral tension at the interface (2). (D) Hydrophobic match. Lipids adapt to the TMD length of the protein by interfacing long TMDs with long acyl chain lipids. (E) Phase separation. Confocal image of a Giant Unilamellar Vesicle (GUV) composed of DOPC/BSM/Chol shows Lo and Ld phases. Green is cholesterol (labeled with TopFluor) which prefers the Lo phase, while red is the Ld phase marker DiI. (F) Protein induced membrane curvature. This Figure is reproduced in colour in the online version of Molecular Membrane Biology.
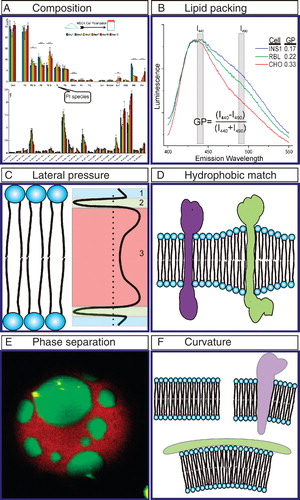
Figure 3. Phase separation in Supported Lipid Bilayers (SLBs). (A) Confocal image of a SLB prepared from DOPC/BSM/C18Cer/Chol mixture and stained with DiD (Ld marker). (B) Topological image of the same membrane obtained with AFM. (C) Intensity and height profile of the membrane above. The DiD containing Ld patches are thinner than the patches Lo regions (Image courtesy of Grzegorz Chwastek). This Figure is reproduced in colour in the online version of Molecular Membrane Biology.
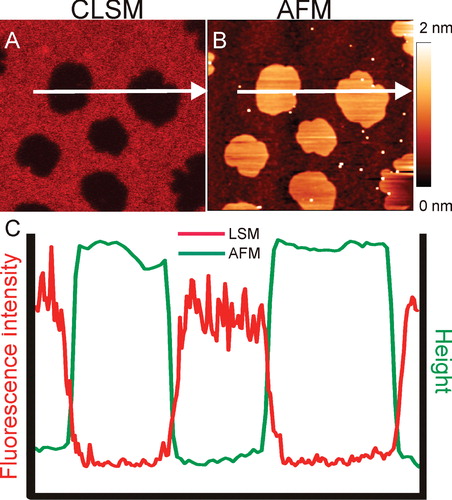
Figure 4. Phase Properties in GUVs. (A) 3D confocal image of phase separation in GUVs composed of DOPC/BSM/Chol (2:2:1; dyes are same as ). (B) Laurdan GP image of a phase separated GUV (same composition as [A]). Ordered phases have higher GP values. (C) Diffusion of a fluorescent molecule in Lo and Ld phases of Giant Unilamellar Vesicles (GUVs) quantified by fluorescence correlation spectroscopy (same composition as [A]). Diffusion is approximately an order of magnitude slower in the Lo phase. (D) Height profile of a burst GUV (same composition as [A]) obtained by AFM. The Lo phase is thicker than Ld phase by about 1 nm. This Figure is reproduced in colour in the online version of Molecular Membrane Biology.
![Figure 4. Phase Properties in GUVs. (A) 3D confocal image of phase separation in GUVs composed of DOPC/BSM/Chol (2:2:1; dyes are same as Figure 2A). (B) Laurdan GP image of a phase separated GUV (same composition as [A]). Ordered phases have higher GP values. (C) Diffusion of a fluorescent molecule in Lo and Ld phases of Giant Unilamellar Vesicles (GUVs) quantified by fluorescence correlation spectroscopy (same composition as [A]). Diffusion is approximately an order of magnitude slower in the Lo phase. (D) Height profile of a burst GUV (same composition as [A]) obtained by AFM. The Lo phase is thicker than Ld phase by about 1 nm. This Figure is reproduced in colour in the online version of Molecular Membrane Biology.](/cms/asset/94e6d21d-387c-45f9-9657-e4e2298676ed/imbc_a_700490_f0004_b.jpg)
Figure 5. Phase Properties in Giant Plasma Membrane Vesicles (GPMVs). (A) Phase separation of GPMVs at 10°C stained with Topfluor Cholesterol (ordered phase), DiI (disordered phase) or Alexa647-Choleratoxin (ordered phase). (B) Laurdan GP image of a phase separated GPMV at 10°C. The order difference between coexisting phases is less pronounced than in GUVs shown in . (C) The diffusion of a fluorescent molecule in two phases of GPMVs measured by FCS. Diffusion in the ordered phase is slower, but much closer to the disordered phase than in GUV shown in . (D) AFM image of a burst GMPV. The surface is covered by proteins. The inset shows the corresponding confocal image of the membrane stained with DiI (disordered phase). This Figure is reproduced in colour in the online version of Molecular Membrane Biology.
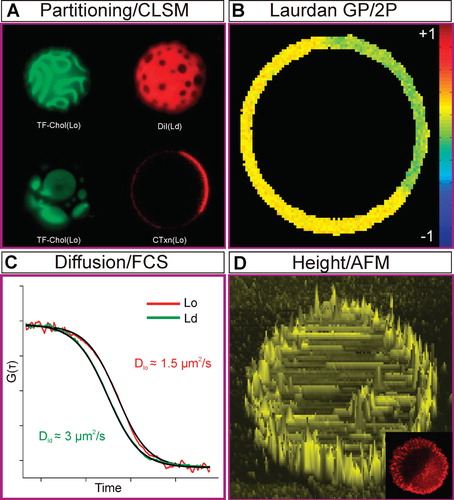
Table I. Pros and cons of model membranes.