540
Views
4
CrossRef citations to date
0
Altmetric
Research Article

Specific aquaporins increase the ammonia tolerance of a Saccharomyces cerevisiae mep1-3fps1 deletion strain

, &
Pages 43-51 | Received 15 Mar 2012, Accepted 05 Jul 2012, Published online: 22 Oct 2012

Figures & data

Figure 1. Comparison of Saccharomyces cerevisiae mep1-3fps1▵ transformant growth on solid or in liquid media with ammonium as the sole nitrogen source. (A) Transformants expressing the aquaglyceroporin Fps1, the water-selective rat AQP1, an ammonia-permeable mutant of rat AQP1 (H180A), or no AQP, were grown on SD KHL medium containing 76 mM ammonium and micromolar concentrations of lysine, histidine and leucine (pH 5.6 set before autoclaving, not additionally buffered) or on assay medium containing 10 mM ammonium as the sole nitrogen source (40 mM MOPS/NaOH, pH 7.7). From left to right, the OD600 of the yeast suspensions placed on the agar decreased from 1 to 10-3 in ten-fold dilution series. Growth was documented after 3 days of incubation at 29°C. (B) Growth of the same yeast transformants in 300 μl liquid media (10 mM ammonium, 40 mM MOPS/NaOH, pH 7.1, 29°C) detected turbidimetrically (OD420-580). Dashed lines mark the boundaries used to calculate areas under the curves (AUC 48 h). For clarity, every other data point is shown.

Figure 1. Comparison of Saccharomyces cerevisiae mep1-3▵ fps1▵ transformant growth on solid or in liquid media with ammonium as the sole nitrogen source. (A) Transformants expressing the aquaglyceroporin Fps1, the water-selective rat AQP1, an ammonia-permeable mutant of rat AQP1 (H180A), or no AQP, were grown on SD KHL medium containing 76 mM ammonium and micromolar concentrations of lysine, histidine and leucine (pH 5.6 set before autoclaving, not additionally buffered) or on assay medium containing 10 mM ammonium as the sole nitrogen source (40 mM MOPS/NaOH, pH 7.7). From left to right, the OD600 of the yeast suspensions placed on the agar decreased from 1 to 10-3 in ten-fold dilution series. Growth was documented after 3 days of incubation at 29°C. (B) Growth of the same yeast transformants in 300 μl liquid media (10 mM ammonium, 40 mM MOPS/NaOH, pH 7.1, 29°C) detected turbidimetrically (OD420-580). Dashed lines mark the boundaries used to calculate areas under the curves (AUC 48 h). For clarity, every other data point is shown.

Figure 2. Dependence of Saccharomyces cerevisiae mep1-3fps1▵ transformant growth on pH (A), ammonium concentration (B), and proline as an alternative nitrogen source (C), in the presence or absence of plasmid-encoded Fps1. Unless mentioned otherwise, the pH was 7.1 (40 mM MOPS/NaOH) and the only nitrogen source was ammonium (10 mM). In the experiment shown in Graph A the medium of pH 7.1 was of a different lot, and pH values below 6.9 were buffered by 40 mM MES/NaOH. Growth was detected turbidimetrically (OD420-580) and quantified by calculating areas under growth curves to 48 h (AUC 48 h). Error bars represent SD (n = 3).

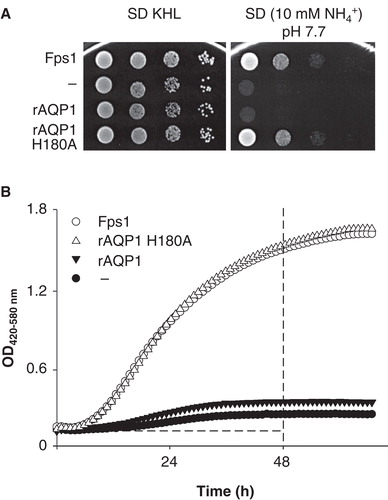
Figure 2. Dependence of Saccharomyces cerevisiae mep1-3▵ fps1▵ transformant growth on pH (A), ammonium concentration (B), and proline as an alternative nitrogen source (C), in the presence or absence of plasmid-encoded Fps1. Unless mentioned otherwise, the pH was 7.1 (40 mM MOPS/NaOH) and the only nitrogen source was ammonium (10 mM). In the experiment shown in Graph A the medium of pH 7.1 was of a different lot, and pH values below 6.9 were buffered by 40 mM MES/NaOH. Growth was detected turbidimetrically (OD420-580) and quantified by calculating areas under growth curves to 48 h (AUC 48 h). Error bars represent SD (n = 3).

Figure 3. Dependence of Saccharomyces cerevisiae mep1-3fps1▵ transformant growth on the ammonium concentration at pH 6.9 (A), 7.2 (B) or 7.5 (C) (40 mM MOPS/NaOH), in the presence or absence of plasmid-encoded Fps1. Growth was detected turbidimetrically (OD420-580) and quantified by calculating areas under growth curves to 48 h (AUC 48 h). Missing data for non-expressing transformants is due to yeast sticking to the edges of the well bottoms after less than 48 h. Error bars represent SD (n = 3).

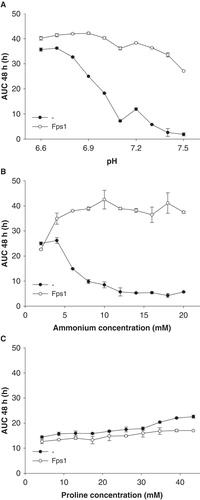
Figure 3. Dependence of Saccharomyces cerevisiae mep1-3▵ fps1▵ transformant growth on the ammonium concentration at pH 6.9 (A), 7.2 (B) or 7.5 (C) (40 mM MOPS/NaOH), in the presence or absence of plasmid-encoded Fps1. Growth was detected turbidimetrically (OD420-580) and quantified by calculating areas under growth curves to 48 h (AUC 48 h). Missing data for non-expressing transformants is due to yeast sticking to the edges of the well bottoms after less than 48 h. Error bars represent SD (n = 3).

Figure 4. Growth of Saccharomyces cerevisiae mep1-3fps1▵ transformants in media of different pH values and various nitrogen sources. (A) Media of different pH but the same initial concentration of unprotonated ammonia (∼ 180 μM) were tested. pH 6.3 and 6.6 were buffered by 40 mM MES/NaOH, pH 6.9 and 7.2 by 40 mM MOPS/NaOH. (B) Yeast expressing Fps1 or no AQP were grown in media at pH 6.9 (40 mM MOPS/NaOH) containing 40 mM proline (Pro), glutamine (Gln), urea, ammonium acetate (NH4 + acet.), ammonium sulfate (NH4 + sulf., 40 mM ammonium ions), ammonium bicarbonate (NH4 + bicarb.) or no (–) added nitrogen source, corresponding to the conditions marked by the grey shaded area in Graph A. (C) Growth of yeast expressing Fps1 or no AQP with 10 mM proline as nitrogen source, and with or without 5 mM ammonium (sulfate salt), as indicated. Please note the different pH-range and ordinate scale as compared to Graph A. Buffering by 40 mM MOPS/NaOH. Growth was detected turbidimetrically (OD420-580) and quantified by calculating areas under growth curves to 48 h (AUC 48 h). Error bars represent SD (n = 4).

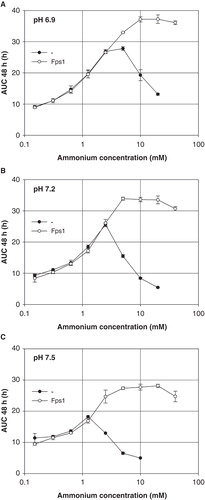
Figure 4. Growth of Saccharomyces cerevisiae mep1-3▵ fps1▵ transformants in media of different pH values and various nitrogen sources. (A) Media of different pH but the same initial concentration of unprotonated ammonia (∼ 180 μM) were tested. pH 6.3 and 6.6 were buffered by 40 mM MES/NaOH, pH 6.9 and 7.2 by 40 mM MOPS/NaOH. (B) Yeast expressing Fps1 or no AQP were grown in media at pH 6.9 (40 mM MOPS/NaOH) containing 40 mM proline (Pro), glutamine (Gln), urea, ammonium acetate (NH4 + acet.), ammonium sulfate (NH4 + sulf., 40 mM ammonium ions), ammonium bicarbonate (NH4 + bicarb.) or no (–) added nitrogen source, corresponding to the conditions marked by the grey shaded area in Graph A. (C) Growth of yeast expressing Fps1 or no AQP with 10 mM proline as nitrogen source, and with or without 5 mM ammonium (sulfate salt), as indicated. Please note the different pH-range and ordinate scale as compared to Graph A. Buffering by 40 mM MOPS/NaOH. Growth was detected turbidimetrically (OD420-580) and quantified by calculating areas under growth curves to 48 h (AUC 48 h). Error bars represent SD (n = 4).

Figure 5. Growth of Saccharomyces cerevisiae mep1-3fps1▵ transformants expressing Fps1 (empty circles) or no AQP (filled circles) in media containing 40 mM of the indicated nitrogen source at pH 6.9 (40 mM MOPS/NaOH), detected turbidimetrically (OD420-580). The binary logarithm of the net OD (blank subtracted) is plotted against time. Values up to about 2-1 correlate closely with yeast cell concentration. OD fluctuations are due to a failing light source. Decreasing OD values (ammonium acetate and bicarbonate) are due to yeast sticking to the edges of the well bottoms. Sample growth curves representative of sets of four each, used to calculate the data shown in .

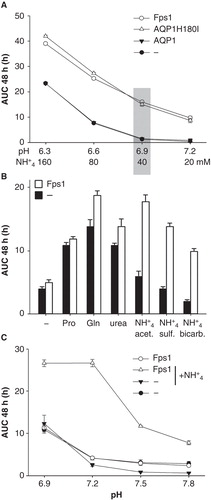
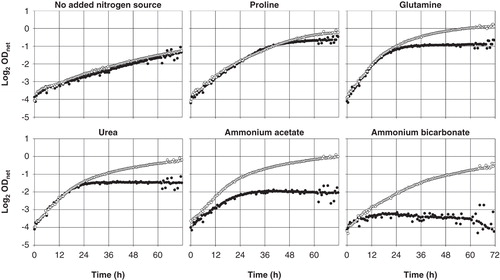
Figure 5. Growth of Saccharomyces cerevisiae mep1-3▵ fps1▵ transformants expressing Fps1 (empty circles) or no AQP (filled circles) in media containing 40 mM of the indicated nitrogen source at pH 6.9 (40 mM MOPS/NaOH), detected turbidimetrically (OD420-580). The binary logarithm of the net OD (blank subtracted) is plotted against time. Values up to about 2-1 correlate closely with yeast cell concentration. OD fluctuations are due to a failing light source. Decreasing OD values (ammonium acetate and bicarbonate) are due to yeast sticking to the edges of the well bottoms. Sample growth curves representative of sets of four each, used to calculate the data shown in Figure 4B.
Supplemental material

Reprints and Corporate Permissions

Please note: Selecting permissions does not provide access to the full text of the article, please see our help page How do I view content?

To request a reprint or corporate permissions for this article, please click on the relevant link below:

Academic Permissions

Please note: Selecting permissions does not provide access to the full text of the article, please see our help page How do I view content?

Obtain permissions instantly via Rightslink by clicking on the button below:

If you are unable to obtain permissions via Rightslink, please complete and submit this Permissions form. For more information, please visit our Permissions help page.