Figures & data
Figure 1. Molecular-dynamics simulations assays. (Left) Typical configuration of the bovine-heart AAC embedded in a fully hydrated POPC bilayer (the chloride counter-ions are depicted as green spheres and water molecules are not represented for clarity) with a nucleotide bound at the bottom of the internal cavity of the carrier. (Right) Starting positions of the nucleotides for the 10 binding assays. Cyan and dark-blue surfaces correspond respectively to nucleotides found in the vicinity of the upper and the lower patches of basic residues. The three major contact points of the binding site that interact with the nucleotides are indicated (I: K22, R79; II: G182, I183; III: R279) (Robinson and Kunji Citation2006).
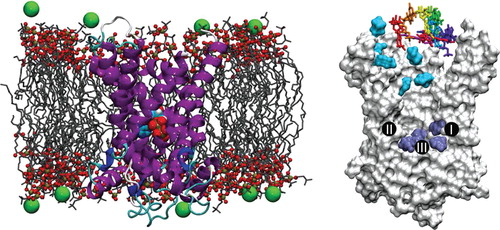
Figure 2. Effect of the nature of the nucleotide on [α-32P]ATP uptake into E. coli cells expressing hAAC1. IPTG-induced E. coli cells harboring plasmid MBP-hAAC1 were incubated in potassium phosphate buffer containing 10 μM labeled ATP. The uptake assay was performed in the absence or in the presence of 100 μM of non-labeled nucleotides and carried out for 30 min. The uptake was terminated by the addition of cold buffer and the samples were filtered. The rate of transport in the absence of additives (No add.) was set to 100%. The control nucleotide uptake (empty vector) was subtracted. Data are the mean of three independent experiments. The average values with standard deviation are shown.
![Figure 2. Effect of the nature of the nucleotide on [α-32P]ATP uptake into E. coli cells expressing hAAC1. IPTG-induced E. coli cells harboring plasmid MBP-hAAC1 were incubated in potassium phosphate buffer containing 10 μM labeled ATP. The uptake assay was performed in the absence or in the presence of 100 μM of non-labeled nucleotides and carried out for 30 min. The uptake was terminated by the addition of cold buffer and the samples were filtered. The rate of transport in the absence of additives (No add.) was set to 100%. The control nucleotide uptake (empty vector) was subtracted. Data are the mean of three independent experiments. The average values with standard deviation are shown.](/cms/asset/0975a6bb-f473-4f65-be9d-e88d19d3375e/imbc_a_745175_f0002_b.jpg)
Figure 3. Expression and transport of ADP by the human AAC1 expressed in Lactococcus lactis. (A) (A) Coomassie brilliant blue-stained SDS- PAGE gel of the cytoplasmic membrane of the control and hAAC1-expressing strain. The arrowhead indicates the expressed hAAC1. (B) Radio-labeled ADP uptake by whole Lactococcus cells in the absence of inhibitors (circles) or in the presence of the specific inhibitors bongkrekic acid (squares) or carboxy-atractyloside (triangles). The results are presented as the average and standard deviation from three independent experiments.
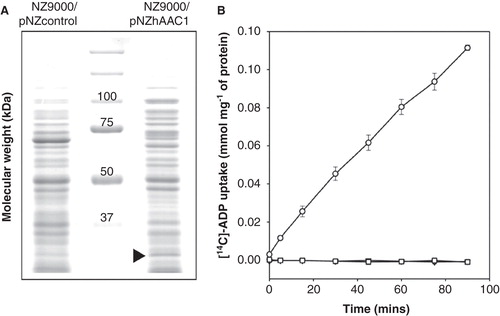
Figure 4. Substrate specificity of the human AAC1 protein. (A) Initial uptake rate of radio-labeled ADP in the presence or absence of a 1000-fold higher concentration of the indicated non-radio-labeled compounds. Uptake was started by the addition of 1.25 μM [14C]-ADP to Lactococcus cells at final A600nm of 8 and after 1 h, the uptake was quenched by adding cold buffer and the sample was filtered. (B) Initial uptake rate of radio-labeled ADP into fused membrane vesicles pre-loaded with 5 mM of the indicated compound. Uptake will only occur if the internal compound can be transported out of the vesicle. Substrate exchange was started by the addition of 1.34 μM [14C]-ADP and the initial rate was determined by measuring the accumulated radio-labeled substrate after 10 min. Experiments were carried out in triplicate and the average with standard deviation is shown.
![Figure 4. Substrate specificity of the human AAC1 protein. (A) Initial uptake rate of radio-labeled ADP in the presence or absence of a 1000-fold higher concentration of the indicated non-radio-labeled compounds. Uptake was started by the addition of 1.25 μM [14C]-ADP to Lactococcus cells at final A600nm of 8 and after 1 h, the uptake was quenched by adding cold buffer and the sample was filtered. (B) Initial uptake rate of radio-labeled ADP into fused membrane vesicles pre-loaded with 5 mM of the indicated compound. Uptake will only occur if the internal compound can be transported out of the vesicle. Substrate exchange was started by the addition of 1.34 μM [14C]-ADP and the initial rate was determined by measuring the accumulated radio-labeled substrate after 10 min. Experiments were carried out in triplicate and the average with standard deviation is shown.](/cms/asset/a13c082a-6d63-47c3-818b-4185813fd0ab/imbc_a_745175_f0004_b.jpg)
Table I. Statistical analysis of the association assays. Binding is considered successful when the nucleotide is found inside the cavity, with the phosphate and the nucleoside moieties steadily bound to the bottom of the carrier over time scales in excess of 15 ns.
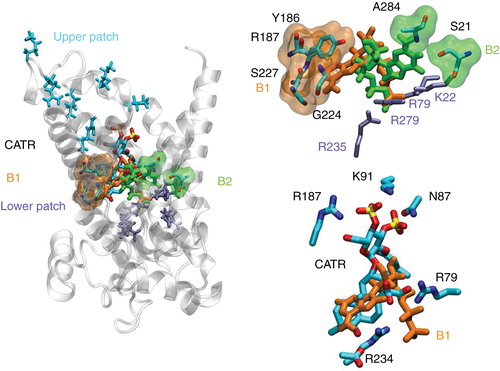
Figure 5. Most populated binding motifs (B1 and B2) revealed by the association-assays. (Left) Global view of the main binding positions of the nucleotides at the bottom of the cavity of AAC near its 1OKC conformation. (Top right) Detailed view of B1 and B2 binding motifs. (Bottom right) Overlap between CATR and B1 binding motifs.