Figures & data
Figure 1. Sequence alignment of NupG and LacY. The rate of evolutionary change (conservation, ‘c') and the frequency of residue type (polarity, ‘p') at each position in multiple sequence alignments of 111 NupG homologues and of 99 LacY homologues, calculated as described in the Methods section, are indicated using the colour scales shown. Residues completely or almost completely conserved in all 210 sequences are indicated by red asterisks. Conserved basic residues of the ‘R-X-G-R-R' motif are indicated by blue asterisks. Conserved positions containing aromatic residues (W, Y or F) or residues with small side chains (G, S, A, C, P or T), used to aid alignment of the two sequences, are indicated by magenta and black asterisks respectively.
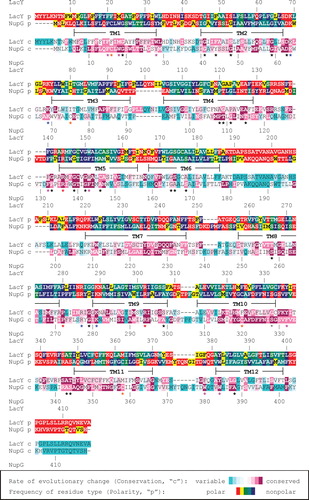
Figure 2. Distribution of polar residues on the surface of a model of NupG based on the inward-facing crystal structure of LacY. (a–d) Molecular surface representations of the model, viewed from the plane of the membrane, successively rotated by 90° around an axis normal to the plane of the membrane. The side chain nitrogen and oxygen atoms of aspartate, glutamate, asparagine, glutamine, lysine and arginine residues are shown in blue and red respectively. The brown rectangles indicate the likely location of the hydrophobic core of the lipid bilayer.
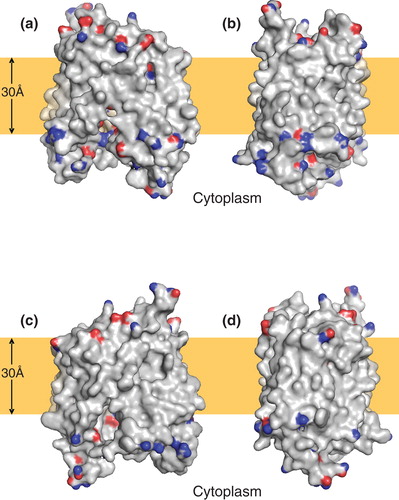
Figure 3. Pattern of residue conservation in LacY and NupG. The rate of evolutionary change at each position in the transporters was calculated using the ConSeq algorithm and mapped onto the crystal structure of LacY and the corresponding inward-facing model of NupG respectively using the colour scale indicated. The structures are shown in cartoon form, with the most variable and conserved positions in solid molecular representation. (a) View from the plane of the lipid bilayer and (b) view from the periplasm.
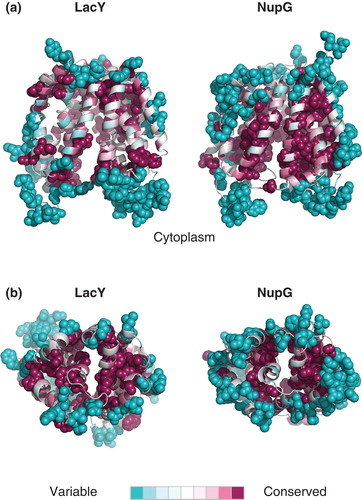
Figure 4. Comparison of (a) inward- and (b) outward-facing models of NupG. TM helices 1–12 are numbered and shown in cartoon form, with evolutionarily-related helices in the N- and C-terminal halves of the protein being given the same colour. The grey rectangles indicate the likely location of the hydrophobic core of the lipid bilayer.
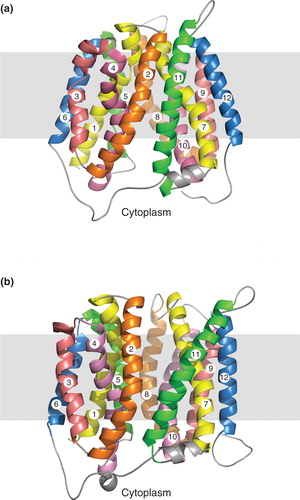
Figure 5. Locations of cysteine residues in NupG. Cross-sections of the transmembrane regions of (a) the inward-facing and (b) the outward-facing models of NupG are illustrated, viewed from the cytoplasmic side of the membrane, showing the locations of the four cysteine residues of the protein in space filling representation. TM helices are shown as α-carbon traces, coloured as in .
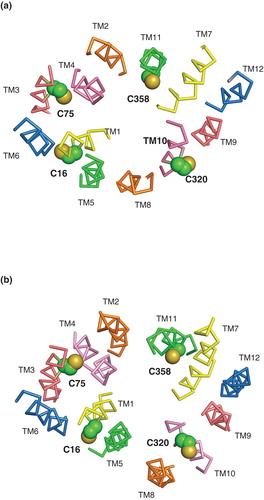
Figure 6. Effect of pCMBS treatment on uridine transport in E. coli cells induced to express wild-type NupG. (a) Concentration-dependence of the effect of pCMBS on uptake of 50 μM uridine, measured for 15 s or 2 min as indicated. Results shown are mean ± SD (n = 3) and have been corrected for uptake into non-induced cells. (b) Reversibility of pCMBS inhibition by DTT. Non-induced (control) or induced cells were treated with or without 100 μM pCMBS for 5 min, washed with transport buffer and then treated with or without 100 mM DTT for 5 min before subsequent measurement of 50 μM uridine uptake, over periods of 15 s or 2 min, as indicated. Results shown are mean ± SD (n = 3).
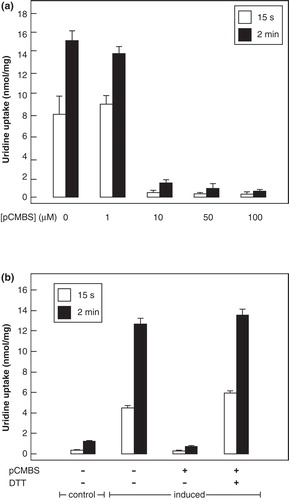
Figure 7. Uridine transport activity of NupG C358 mutants. (a) Uptake of 50 μM uridine, measured for 15 s or 2 min as indicated, in E. coli cells harbouring vectors encoding wild-type NupG or its C358A or C358S mutants, before and after induction of expression by treatment with IPTG for 1 h. Results shown are mean ± SD (n = 3). (b) Concentration dependence of uridine uptake, measured over a period of 15 s, in E. coli cells induced to express the C358S mutant of NupG. Data shown are mean ± SD (n = 3) and have been corrected for the endogenous uridine uptake activity found in non-induced cells. The line shows the fit of the data to the Michaelis-Menten equation, obtained by non linear regression.
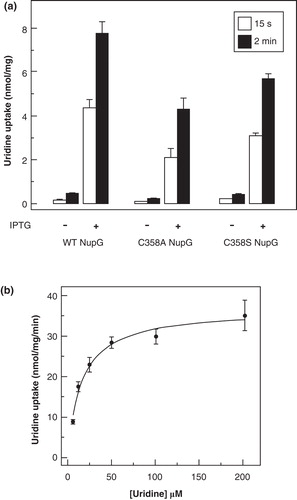
Table I. Kinetic properties of wild-type NupG and its mutants.
Figure 8. Effect of pCMBS treatment on uridine transport in E. coli cells induced to express cysteine mutants of NupG. (a) Cells induced to express the indicated mutants were treated with (solid bars) or without (open bars) 100 μM pCMBS for 5 min and then washed with transport buffer before subsequent measurement of 50 μM uridine uptake, over a period of 2 min. Results shown are mean ± SD (n = 3). (b) Cross-section of the transmembrane region of the inward-facing NupG model, viewed from the cytoplasmic side of the membrane. (c) Cross-section of the outward-facing NupG model, viewed from the periplasmic side of the membrane. The locations of the residues replaced by cysteine are shown in space filling representation. TM helices are shown as α-carbon traces, coloured as in .
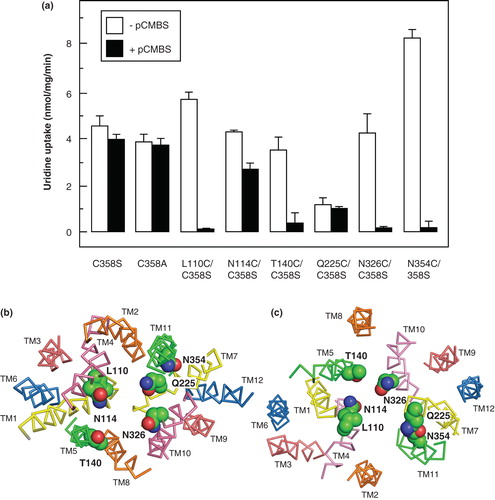
Figure 9. Comparison of the uridine transport activity of wild-type NupG with that of variants bearing mutations of highly conserved residues in TM7, TM8 and TM9. (a) Uptake of 50 μM uridine, measured for 15 s or 2 min as indicated, in E. coli cells induced by treatment with IPTG for 1 h or, in the case of D323N, 3 h, to express WT NupG or the indicated mutants. Results shown are mean ± SD (n = 3). The panel below the histogram shows a western blot of membrane samples (20 μg) from the corresponding cultures, stained for the His-tagged NupG protein. (b) Cross-section of the transmembrane region of the inward-facing NupG model, viewed from the cytoplasmic side of the membrane, and (c) cross-section of the outward-facing NupG model, viewed from the periplasmic side of the membrane, showing the locations of the mutated residues, in space filling representation. TM helices are shown as α-carbon traces, coloured as in .
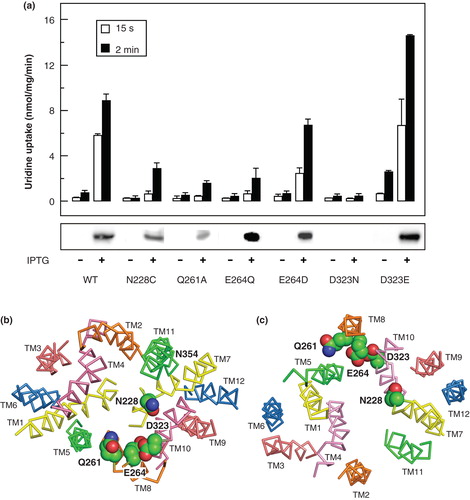
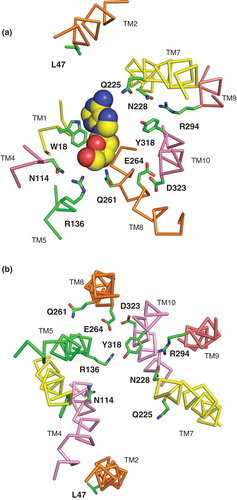
Figure 10. Residues predicted to be important in the mechanism of nucleoside transport by NupG. (a) Cross-section of part of the transmembrane region of the inward-facing NupG model, viewed from the cytoplasmic side of the membrane and (b) cross-section of part of the transmembrane region of the outward-facing NupG model, viewed from the periplasmic side of the membrane. The locations of residues likely to play roles in nucleoside recognition and/or proton translocation are indicated. TM helices are shown as α-carbon traces, coloured as in . In (a) an adenosine molecule in space filling representation has been manually placed, for scale, at a position analogous to that occupied by TDG in the crystal structure of the inward-facing form of LacY.