Figures & data
Table I. Primers used for the construction pAMP31-GGGSAGGGS-proX. Restriction sites are indicated in bold and underlined. Nucleotides different from those in wild-type ProX are indicated in italics.
Figure 1. Panel A: Schematic representation of the organization of the subunits in ProU (Panel A); the engineered lipid-anchored ProX, the membrane-embedded TMD ProW, and the NBD ProV are shown. Panel B: Schematic of proteoliposomes with ProVW in two orientations, ProX tethered to the external surface, and the ATP-regenerating system (ARS) in the vesicle lumen. Only right-side-out ProVW plus ProX will facilitate the uptake of glycine betaine. This Figure is reproduced in colour in Molecular Membrane Biology online.
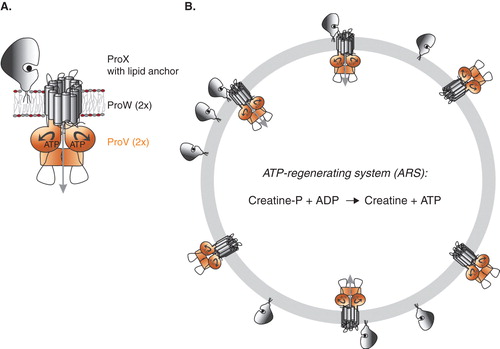
Figure 2. In vivo glycine betaine uptake. Panel A: Expression levels of ProX and ProW in L. lactis Opu401 co-transformed with pNZcLICproVW and pAMP31-GGGSAGGGS-proX and grown in GM17 and GCDM. Panel B: Rate of glycine betaine uptake as a function of sucrose concentration for GCDM- (•) and GM17-grown (○) cells of L. lactis expressing ProVW and ProX. L. lactis Opu401 cells, co-transformed with pNZcLICproVW and pAMP31-GGGSAGGGS -proX, were grown semi-aerobically at 30°C in GM17 and GCDM with 2.5 μg/ml chloroamphenicol plus 2.5 μg/ml erythromycin. Induction with 0.01% (v/v) nisinA was performed for 2 h, prior to harvesting of the cells for the transport assays. Uptake of [14C]glycine betaine (1 mM, final concentration) was assayed in 50 mM HEPES-methylglucamine pH 7.0 in the presence of 10 mM glucose plus 25 μg/ml chloroamphenicol and erythromycin; the final cell concentration in the assay buffer was 0.5 mg/ml. The initial rates of uptake were determined from the linear parts of the progress curves; measurements were done in duplicate. This Figure is reproduced in colour in Molecular Membrane Biology online.
![Figure 2. In vivo glycine betaine uptake. Panel A: Expression levels of ProX and ProW in L. lactis Opu401 co-transformed with pNZcLICproVW and pAMP31-GGGSAGGGS-proX and grown in GM17 and GCDM. Panel B: Rate of glycine betaine uptake as a function of sucrose concentration for GCDM- (•) and GM17-grown (○) cells of L. lactis expressing ProVW and ProX. L. lactis Opu401 cells, co-transformed with pNZcLICproVW and pAMP31-GGGSAGGGS -proX, were grown semi-aerobically at 30°C in GM17 and GCDM with 2.5 μg/ml chloroamphenicol plus 2.5 μg/ml erythromycin. Induction with 0.01% (v/v) nisinA was performed for 2 h, prior to harvesting of the cells for the transport assays. Uptake of [14C]glycine betaine (1 mM, final concentration) was assayed in 50 mM HEPES-methylglucamine pH 7.0 in the presence of 10 mM glucose plus 25 μg/ml chloroamphenicol and erythromycin; the final cell concentration in the assay buffer was 0.5 mg/ml. The initial rates of uptake were determined from the linear parts of the progress curves; measurements were done in duplicate. This Figure is reproduced in colour in Molecular Membrane Biology online.](/cms/asset/2d63c9e9-bc15-4841-86d3-f94765a94a5e/imbc_a_754060_f0002_b.jpg)
Figure 3. Expression of ProVW and ProX. SDS-PAGE (12% gel) stained with Coomassie brilliant blue. Lane 1: Membrane vesicles of E. coli harboring pBADcLICproVW; lane 2: Purified ProVW; lane 3: Membrane vesicles of L. lactis harboring pAMP31 + GGGSAGGGS + proX; lane 4: Purified ProX; lane 5: proteoliposomes with ProVW; and lane 6: proteoliposomes with ProVW and ProX. This Figure is reproduced in colour in Molecular Membrane Biology online.
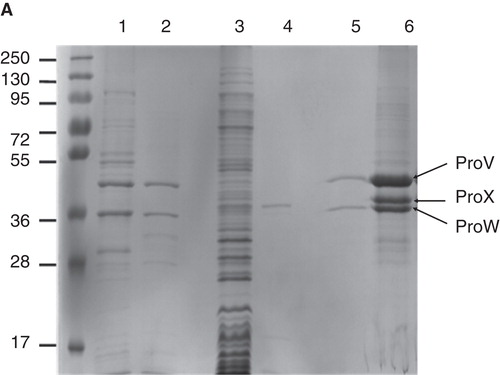
Figure 4. Glycine betaine binding to ProX. Glycine betaine binding to purified ProX with lipid anchor and flexible linker. The lipid-anchored ProX was kept soluble by including of 0.05% (w/v) DDM in the assay buffer (100 mM KPI, pH 7.0). See Materials and methods for further details. This Figure is reproduced in colour in Molecular Membrane Biology online.
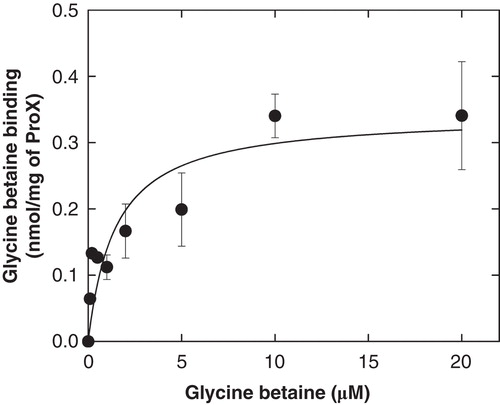
Figure 5. Glycine betaine uptake in proteoliposomes. ProU was reconstituted in liposomes composed of E. coli polar lipids and L-α-phosphatidyl choline from egg yolk in a ratio of 3:1 (w/w); the final ProVW concentration was 0.05 mg/ml. Panel A: [14C]-glycine betaine uptake (40 μM, final concentration) assayed in 100 mM KPi, pH 7.0 plus 300 mM KCl with an ATP-regenerating system enclosed in the vesicle lumen, composed of E. coli polar lipids plus L-α-phosphatidyl choline from egg yolk in a ratio of 3:1 (w/w). Time course of uptake (•); after 3 min of uptake 5 mM Mg-ATP () or 5 mM glycine betaine (○) was added to the assay mixture. Panel B: [14C]-glycine betaine uptake (40 μM, final concentration) assayed in 100 mM KPi, pH 7.0, under iso-osmotic (▵,▴) and hyperosmotic (○,•) conditions (100 mM KPi + 300 mM KCl); with (open symbols) and without (closed symbols) 5 mM glycine betaine in the stop buffer. Panel C: Rate of glycine betaine uptake as a function of KCl concentration, added to 100 mM KPi, pH 7.0 assay buffer. This Figure is reproduced in colour in Molecular Membrane Biology online.
![Figure 5. Glycine betaine uptake in proteoliposomes. ProU was reconstituted in liposomes composed of E. coli polar lipids and L-α-phosphatidyl choline from egg yolk in a ratio of 3:1 (w/w); the final ProVW concentration was 0.05 mg/ml. Panel A: [14C]-glycine betaine uptake (40 μM, final concentration) assayed in 100 mM KPi, pH 7.0 plus 300 mM KCl with an ATP-regenerating system enclosed in the vesicle lumen, composed of E. coli polar lipids plus L-α-phosphatidyl choline from egg yolk in a ratio of 3:1 (w/w). Time course of uptake (•); after 3 min of uptake 5 mM Mg-ATP () or 5 mM glycine betaine (○) was added to the assay mixture. Panel B: [14C]-glycine betaine uptake (40 μM, final concentration) assayed in 100 mM KPi, pH 7.0, under iso-osmotic (▵,▴) and hyperosmotic (○,•) conditions (100 mM KPi + 300 mM KCl); with (open symbols) and without (closed symbols) 5 mM glycine betaine in the stop buffer. Panel C: Rate of glycine betaine uptake as a function of KCl concentration, added to 100 mM KPi, pH 7.0 assay buffer. This Figure is reproduced in colour in Molecular Membrane Biology online.](/cms/asset/c036ce02-4a5a-433a-884b-76d665c12ab5/imbc_a_754060_f0005_b.jpg)
Figure 6. Effect of anionic lipids on glycine betaine uptake. ProU was reconstituted in liposomes composed of 50 mol% DOPE and 0 (▪), 12 (∇), 25 (), 38 (○), 50 (•) mol% DOPG, plus 50, 38, 25, 12 and 0 mol% DOPC. The ATP-regenerating system was enclosed in the vesicle lumen; the final ProVW concentration in the assay medium was 0.05 mg/ml. The rate of [14C]-glycine betaine uptake (40 μM, final concentration) was assayed in 100 mM KPi, pH 7.0, and different concentrations of KCl. This Figure is reproduced in colour in Molecular Membrane Biology online.
![Figure 6. Effect of anionic lipids on glycine betaine uptake. ProU was reconstituted in liposomes composed of 50 mol% DOPE and 0 (▪), 12 (∇), 25 (), 38 (○), 50 (•) mol% DOPG, plus 50, 38, 25, 12 and 0 mol% DOPC. The ATP-regenerating system was enclosed in the vesicle lumen; the final ProVW concentration in the assay medium was 0.05 mg/ml. The rate of [14C]-glycine betaine uptake (40 μM, final concentration) was assayed in 100 mM KPi, pH 7.0, and different concentrations of KCl. This Figure is reproduced in colour in Molecular Membrane Biology online.](/cms/asset/e489631a-b137-4a10-b9bc-618e99bf17e1/imbc_a_754060_f0006_b.jpg)