Figures & data
Figure 1. Summary of the chemical structures of the compounds used in this study. All compounds are derived from zosuquidar, a third-generation P-gp inhibitor.
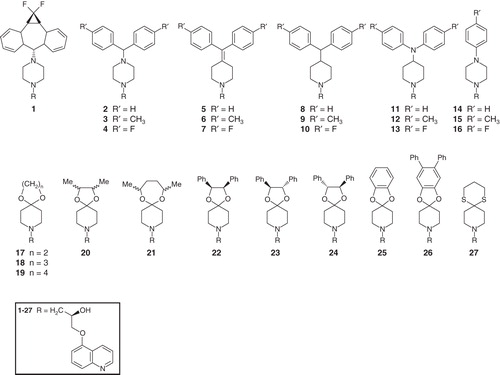
Table I. ATPase and transport activity of Pdr5, LmrA and LmrCD in the presence of zosuquidar (1) or zosuquidar derivatives (2- 27); 100% activity corresponds to ATPase or transport activity of Pdr5, LmrA or LmrCD in the absence of zosuquidar or the derivatives. The assays were performed as described in Materials and method s. The ATPase activity of Pdr5 and LmrCD was determined in the presence of 150 nM rhodamine 6G and 500 nM Hoechst 33342, respectively. The reported values represent the average of three independent experiments with the standard deviation given as error.
Figure 2. Determination of IC50 values for rhodamine 6G transport (A–D) and ATPase activity (E–H) of Pdr5. The activity of Pdr5 was determined with increasing concentrations of 2 (A & E), 7 (B & F), 11 (C & G) and 23 (D & H). The transport and ATP assays were performed in the presence of the indicated compounds as described in Materials and methods.
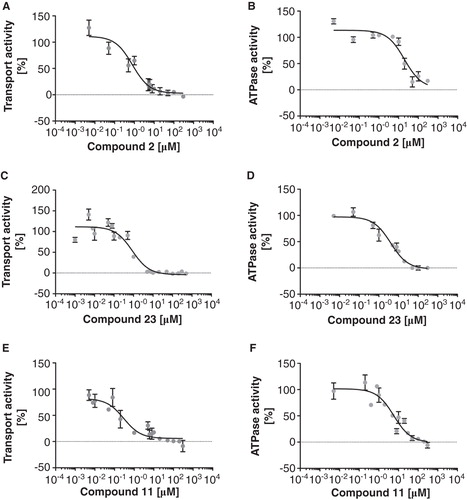
Figure 3. Ethidium transport by L. lactis cells expressing LmrA, LmrA E512Q or LmrCD. Green line: LmrA after the addition of glucose; dashed, green line: LmrA after the addition of water as control; dotted, green line: LmrA after the addition of glucose and compound 1; black line: LmrA E512Q after the addition of glucose; blue line: LmrCD after the addition of glucose. An arrow indicates the addition of glucose, water or glucose and compound 1. The transport assay was performed as described in Materials and methods. This Figure is reproduced in colour in Molecular Membrane Biology online.
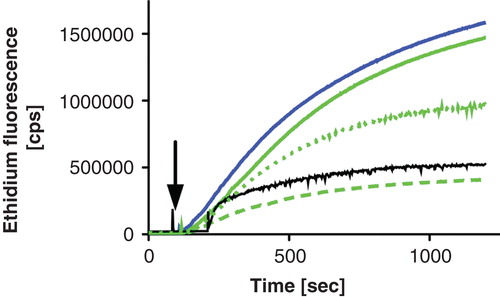
Figure 4. Confocal LSM images of ATPase-deficient LmrA E512Q expressing L. lactis cells in the absence (A) or presence (B) of glucose and of LmrA expressing L. lactis cells in the absence (C) or presence (D) of glucose. Cells were loaded with 40 μM ethidium and pictures were acquired as outlined in Materials and methods. This Figure is reproduced in colour in Molecular Membrane Biology online.
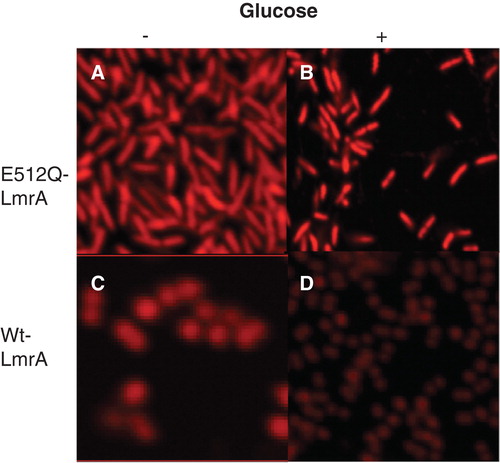
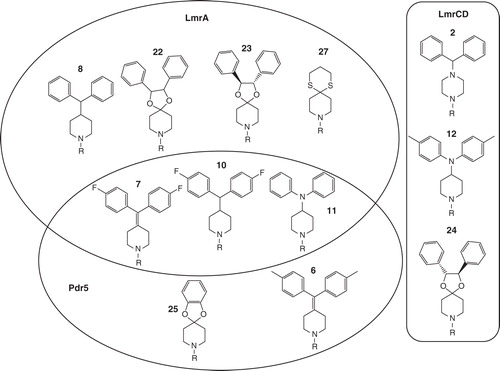
Figure 5. Schematic summary of the zosuquidar derivatives that displayed the most prominent effect on transport of LmrA, LmrCD and Pdr5. Substances were grouped by circles or a box according to the ABC transporter for which they showed the most prominent effect to highlight the partial overlap between the substrate binding sites of LmrA and Pdr5.