Figures & data
Figure 1. Growth of released 3D structures of soluble (upper panel) and membrane proteins (lower panel) that are classified in the Protein Data Bank and in the Membrane Protein Database, respectively. The data were adapted from PDB (http://www.rcsb.org) and Membrane Protein Data Bank (http://www.mpdb.tcd.ie) statistics. Yearly growth trends are also shown.
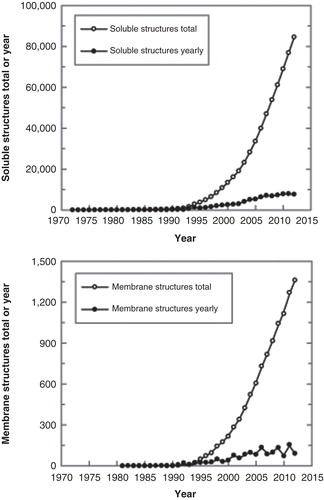
Figure 2. A fluid mosaic model of the cell membrane. Membrane proteins are difficult to produce in the laboratory, because they are often unstable unless bound to lipids. Membrane proteins can be stabilized during CFPS with surfactants and/or lipids (Periasamy et al. Citation2013). The Figure is based on a publicly available image. This Figure is reproduced in colour in Molecular Membrane Biology online.
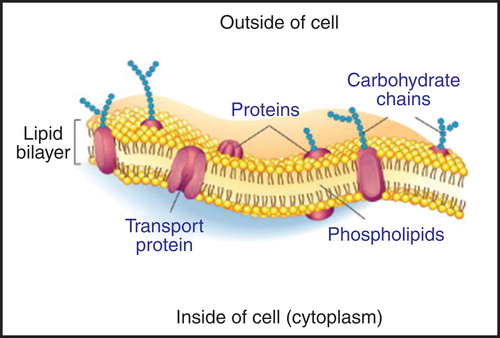
Figure 3. The key steps during cell-free synthesis of membrane proteins and common tools for evaluation of functional and structural properties of synthesized proteins. The relationship between CFPS and nanotechnology is outlined. The Figure illustrates the two modes of CFPS in batch and continuous exchange modes, and summarizes five main steps during CFPS leading to a functional membrane protein, including optimization of conditions, protein analysis and purification, biophysical, functional and structural characterization. Further description is provided in the relevant sections of the text. This Figure is reproduced in colour in Molecular Membrane Biology online.
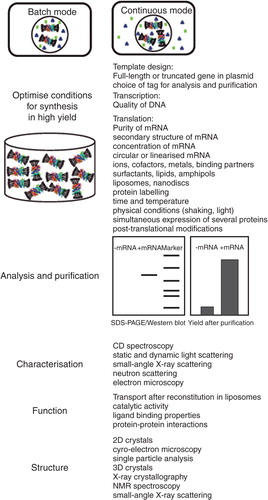
Figure 4. Schematics of assembly of different membrane model systems (a), and detailed views of liposomes (b), tethered bilayers (c) and nanodiscs (d). These environments are suitable for incorporation of membrane proteins from CFPS. The figure is based on Köper et al. (Citation2006), a public image, Braunagel et al. (Citation2011) and Leitz et al. (Citation2006). This Figure is reproduced in colour in Molecular Membrane Biology online.
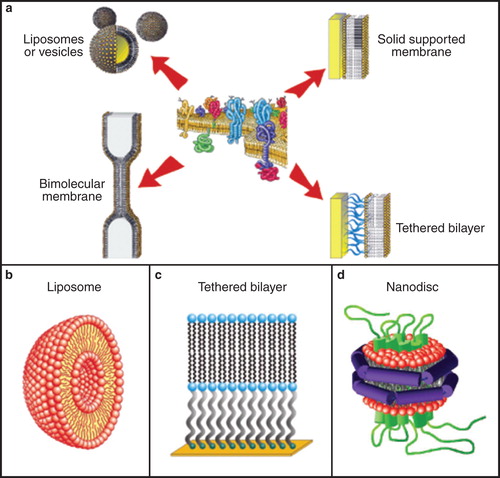
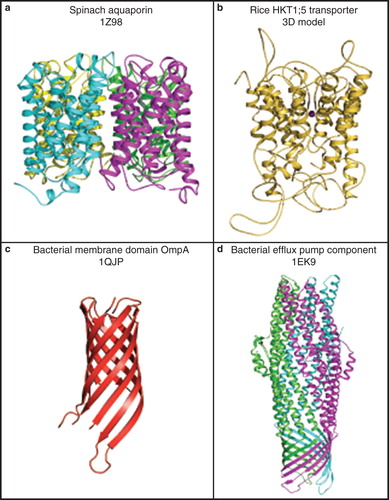
Figure 5. Cartoon representations of molecular folds of plant and bacterial membrane transport proteins. (a) A 3D structure of a spinach aquaporin α-helical bundle structure (PDB ID 1Z98), shown in a tetrameric arrangement (Törnroth-Horsefield et al. Citation2006). Cyan, magenta, yellow and green indicate folds of individual protomers forming a functional tetramer. (b) A 3D model of the rice HKT1;5 transporter showing a complex α-helical structure with extended loops (Cotsaftis et al. Citation2012). (c) A 3D structure of a bacterial membrane domain of OmpA (PDB ID 1QJP) showing its β-barrel fold (Pautsch and Schulz Citation2000). (d) A 3D structure of a bacterial efflux pump component (PDB ID 1EK9) showing an α-helical barrel structure. A trimeric arrangement illustrates a combined fold consisting of the α-helical and β-barrel structural components (Koronakis et al. Citation2000). Green, magenta, and cyan indicate folds of individual protomers forming a functional trimer. Molecular graphics was generated with the PyMol software package (http://www.pymol.org/). This Figure is reproduced in colour in Molecular Membrane Biology online.