Figures & data
Table I. Primer sequences and reaction conditions used in the PCR amplification of the various cDNAs.
Table II. Statistical parameters of the two-way ANOVAS corresponding to the results presented in .
Figure 1. Changes in serum concentrations of prolactin, progesterone, and corticosterone in response to ether exposure in OFA, SD, and Wistar rats during the estrous cycle, late pregnancy, and mid-lactation. Panel A: prolactin (PRL), Panel B: progesterone (P4), Panel C: corticosterone. Groups of 8–10 rats were moved to an experimental room and exposed to ether vapor for 2 min. Tail vein blood samples were collected as indicated; basal samples were taken under light ether anesthesia. Hormones were measured by radioimmunoassay in serum. Values are mean ± SEM. *P < 0.05 vs. basal concentration in the same strain, #P < 0.05 vs. Wistar rats at same time point, ‡P < 0.05 vs. SD rats at same time point; two-way ANOVA and τ-test.
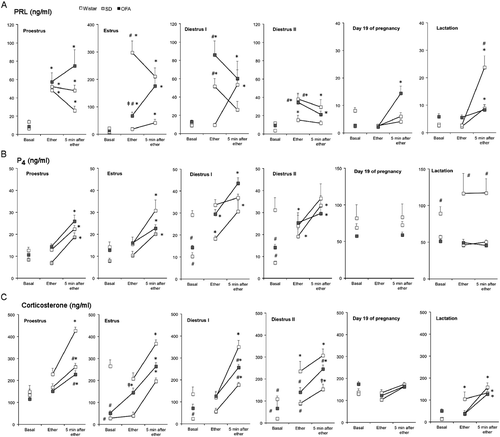
Figure 2. Changes in serum concentrations of prolactin, progesterone, and corticosterone in response to ether exposure in ovariectomized rats after steroid hormone administration. Panel A: prolactin (PRL), Panel B: progesterone (P4), Panel C: corticosterone. Two weeks after ovariectomy rats were divided into four groups: ovariectomized with oil administration (OVX); ovariectomized treated with estradiol benzoate (5 μg/rat s.c. 48 h previously, OVX+E2); ovariectomized treated with progesterone (5 mg/rat s.c. 14 and 2 h previously, OVX + P4); ovariectomized treated with estradiol and progesterone (OVX + E2P4). Groups of eight rats were moved to an experimental room and exposed to ether vapor for 2 min. Tail vein blood samples were collected as indicated; basal samples were taken under light ether anesthesia. Hormones were measured by radioimmunoassay in serum. Values are mean ± SEM. *P < 0.05 vs. basal concentrations of the same strain, #P < 0.05 vs. Wistar rats at the same time point, ‡P < 0.05 vs. SD rats at the same time point; two-way ANOVA and τ-test.
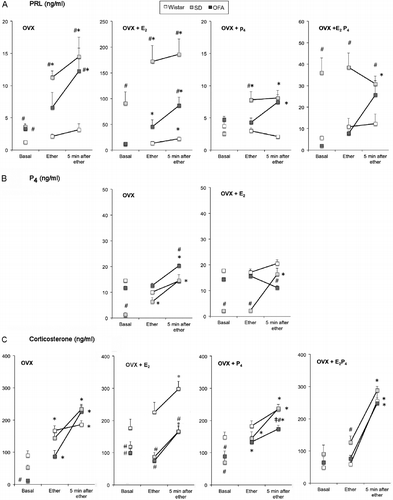
Figure 3. Effect of ether exposure on suckling-induced milk ejection and circulating hormones. Panel A: effect of stress on suckling-induced hormone release in lactating Wistar (Wi), SD, and OFA rats. Litters were separated from the mothers at 08.00 h for 8 h on 3 days. On day 2, dams were exposed to ether vapor for 2 min before reunion. Tail vein blood samples were collected under light ether anesthesia before pups were returned and after suckling for 30 min. Hormones were measured by radioimmunoassay in serum. Panel B: amount of milk drawn per pup nursed by non-stressed (day 1 and 3) and stressed mothers (day 2). The litters were weighed before reunion with their mothers at 16.00 h (0) and after 0.5, 2, and 4 h of suckling. Data are weight change between weighings. Panel C: total amount of milk obtained per pup in the 4 h suckling period. Data are mean ± SEM; n = 8–10 rats per group. Data were analyzed by two-way ANOVA and τ-test.
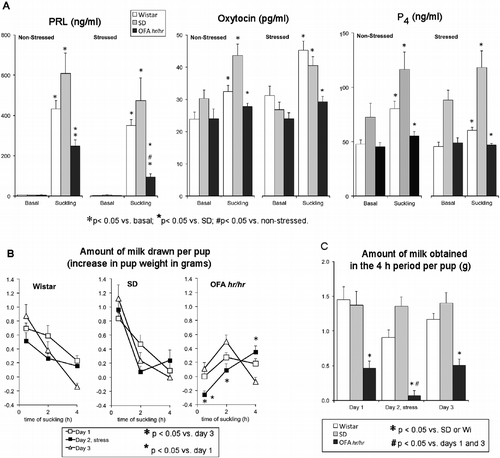
Table III. Statistical parameters of the two-way ANOVAS corresponding to the results presented in .
Figure 4. Effect of diazepam on the lactation performance of OFA hr/hr rats. Panel A: the percentage of surviving litters. Panel B: number of surviving pups per litter. Panel C: pup weight gain. Panel D: serum prolactin concentrations on days 2 (L2) and 7 (L7) and after 8 h separation (separated) and 30 min suckling (suckled) on day 12 of lactation (L12). Lactating OFA rats were given diazepam (DZP) in the drinking water or water alone (Co) from day 19 of pregnancy until day 15 of lactation. OFA dams nursed eight SD foster pups. Data are mean ± SEM of groups of 18 rats for panels A–C and 8–10 rats for panel D. *P < 0.05 vs. control rats; two-way ANOVA and τ-test.
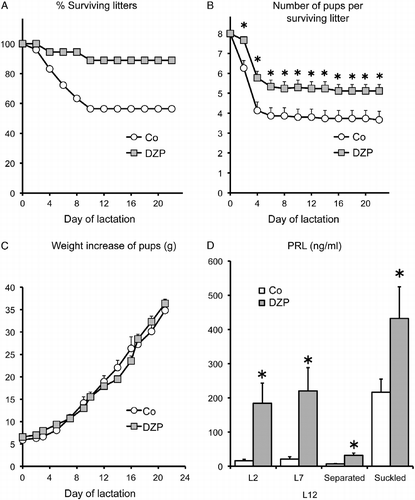
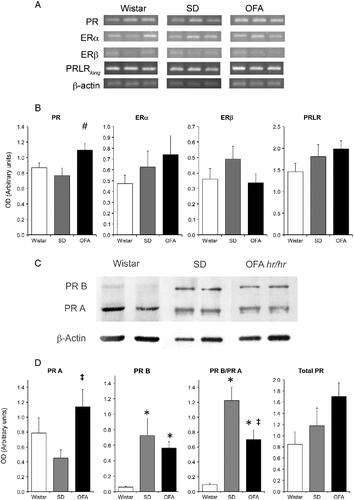
Figure 5. Hypothalamic prolactin (long form, PRLRlong), estradiol (ER), and progesterone (PR) receptor mRNA abundance by RT PCR and progesterone receptor protein by Western blot at the end of pregnancy in OFA, SD, and Wistar rats. Panel A: representative photograph of RT-PCR products run in 1.5% agarose gel of three samples of each strain of rats. Panel B: semiquantitative PCR analysis of total PR, ERα, ERβ, and PRLRlong mRNA abundance relative to β-actin in mediobasal hypothalamus (MBH). Panel C: representative immunoblots of hypothalamic PR isoforms and β-actin in the three rat strains. Panel D: expression relative to β-actin of PR isoforms A and B, PR isoform ratio, and total PR. Data are mean ± SEM; n = 8 rats of each strain. #P < 0.05 vs. Wistar and SD rats, *P < 0.05 vs. Wistar rats, ‡P < 0.05 vs. SD rats; two-way ANOVA and τ-test.