Publication Cover
Stress
The International Journal on the Biology of Stress
Volume 15, 2012 - Issue 4
350
Views
33
CrossRef citations to date
0
Altmetric
Original Research Reports

Effect of stress on hippocampal nociceptin expression in the rat

, , , &
Pages 378-384 | Received 23 Feb 2011, Accepted 16 Aug 2011, Published online: 04 Jan 2012

Figures & data

Figure 1.  Effects of acute restraint stress on hippocampal nociceptin expression. (A) Representative photomicrographs showing the increase in immunoreactivity in the CA1, CA3, and DG areas of naive rats (left panels) and rats subjected to 120 min of restraint stress (right panels). Immunohistochemical pictures are shown together with their localization in the hippocampus at level – 2.8 mm of bregma (upper panel). All images are magnified equally (200 × ). (B) Representative immunoreactivity photomicrographs of the same areas as those in (A) magnified equally (400 × ). (C) Semiquantitative analysis of N/OFQ immunoreactivity signal in hippocampal subfields. Values are expressed as means OD ± SEM (n = 6) rats per group. *p < 0.05, **p < 0.01 versus corresponding naive group (Student's t-test). (D) Semiquantitative analysis of N/OFQ immunoreactivity signal in prefrontal cortex, hypothalamus, and striatum. Values are expressed as means OD ± SEM (n = 6) rats per group.
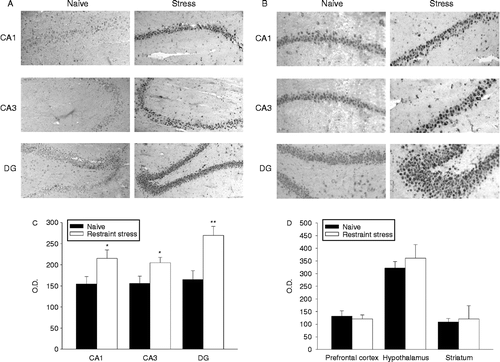
Figure 1.  Effects of acute restraint stress on hippocampal nociceptin expression. (A) Representative photomicrographs showing the increase in immunoreactivity in the CA1, CA3, and DG areas of naive rats (left panels) and rats subjected to 120 min of restraint stress (right panels). Immunohistochemical pictures are shown together with their localization in the hippocampus at level – 2.8 mm of bregma (upper panel). All images are magnified equally (200 × ). (B) Representative immunoreactivity photomicrographs of the same areas as those in (A) magnified equally (400 × ). (C) Semiquantitative analysis of N/OFQ immunoreactivity signal in hippocampal subfields. Values are expressed as means OD ± SEM (n = 6) rats per group. *p < 0.05, **p < 0.01 versus corresponding naive group (Student's t-test). (D) Semiquantitative analysis of N/OFQ immunoreactivity signal in prefrontal cortex, hypothalamus, and striatum. Values are expressed as means OD ± SEM (n = 6) rats per group.

Figure 2.  Effect of corticosterone administration on hippocampal nociceptin expression. (A) Representative photomicrographs showing the increase in CA1, CA3, and DG areas in vehicle (sesame oil) (left panels) and rats injected with corticosterone (1 mg/kg s.c.) (right panels). Immunohistochemical pictures are shown together with their localization in the hippocampus at level – 2.8 mm of bregma. All images are magnified equally (200 × ). (B) Semiquantitative analysis of N/OFQ immunoreactivity signal in hippocampal subfields. Values are expressed as means OD ± SEM (n = 6) rats per group. **p < 0.01 versus corresponding vehicle-treated group (Student's t-test).
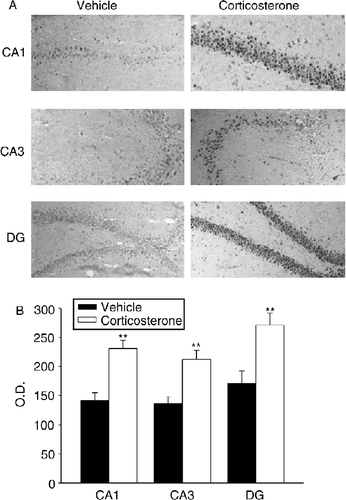
Figure 2.  Effect of corticosterone administration on hippocampal nociceptin expression. (A) Representative photomicrographs showing the increase in CA1, CA3, and DG areas in vehicle (sesame oil) (left panels) and rats injected with corticosterone (1 mg/kg s.c.) (right panels). Immunohistochemical pictures are shown together with their localization in the hippocampus at level – 2.8 mm of bregma. All images are magnified equally (200 × ). (B) Semiquantitative analysis of N/OFQ immunoreactivity signal in hippocampal subfields. Values are expressed as means OD ± SEM (n = 6) rats per group. **p < 0.01 versus corresponding vehicle-treated group (Student's t-test).

Figure 3.  Effects of acute restraint stress on hippocampal nociceptin expression in rats subjected to adrenalectomy. (A) Representative photomicrographs of CA1, CA3, and DG regions in sham-operated group (SHAM) rats and adrenalectomized (ADX) rats. Control animals were left undisturbed while stressed animals were subjected to 120-min restraint stress. Immunohistochemical pictures show the hippocampus at level – 2.8 mm of bregma. All images are magnified equally (200 × ). (B) Semiquantitative analysis of N/OFQ immunoreactivity signal in hippocampal subfields. Values are expressed as means OD ± SEM (n = 6) rats per group. #p < 0.01, §p < 0.05 versus corresponding sham-adrenalectomized group. Significant differences between the stress and control group are expressed as *p < 0.05 and **p < 0.01 (Newman–Keuls multiple-comparison test).

Figure 3.  Effects of acute restraint stress on hippocampal nociceptin expression in rats subjected to adrenalectomy. (A) Representative photomicrographs of CA1, CA3, and DG regions in sham-operated group (SHAM) rats and adrenalectomized (ADX) rats. Control animals were left undisturbed while stressed animals were subjected to 120-min restraint stress. Immunohistochemical pictures show the hippocampus at level – 2.8 mm of bregma. All images are magnified equally (200 × ). (B) Semiquantitative analysis of N/OFQ immunoreactivity signal in hippocampal subfields. Values are expressed as means OD ± SEM (n = 6) rats per group. #p < 0.01, §p < 0.05 versus corresponding sham-adrenalectomized group. Significant differences between the stress and control group are expressed as *p < 0.05 and **p < 0.01 (Newman–Keuls multiple-comparison test).

Figure 4.  Measurement of N/OFQ-immunoreactivity (OFQ/N-ir) in rat brain regions. Hippocampal N/OFQ immunoreactivity in adrenal-intact rats subjected to 120-min restraint stress (panel A) or corticosterone (1 mg/kg s.c.) in sesame oil (panel B). The effect of restraint stress on hippocampal N/OFQ-ir level in adrenalectomized (ADX) rats is shown in panel C. Panel D represents the effect of restraint stress on the content of N/OFQ-ir in selected brain regions. Each sample was assayed in triplicate for N/OFQ-ir. Values are expressed as mean fmol/mg tissue ± SEM; n = six rats per group. *p < 0.05, **p < 0.01 versus corresponding control group (Student's t-test).
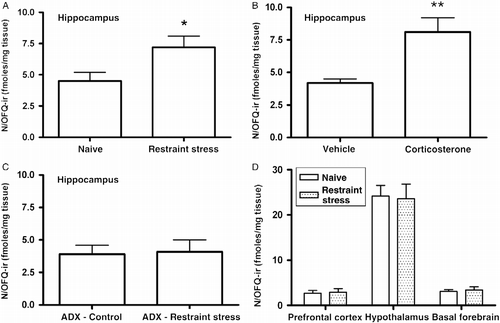
Figure 4.  Measurement of N/OFQ-immunoreactivity (OFQ/N-ir) in rat brain regions. Hippocampal N/OFQ immunoreactivity in adrenal-intact rats subjected to 120-min restraint stress (panel A) or corticosterone (1 mg/kg s.c.) in sesame oil (panel B). The effect of restraint stress on hippocampal N/OFQ-ir level in adrenalectomized (ADX) rats is shown in panel C. Panel D represents the effect of restraint stress on the content of N/OFQ-ir in selected brain regions. Each sample was assayed in triplicate for N/OFQ-ir. Values are expressed as mean fmol/mg tissue ± SEM; n = six rats per group. *p < 0.05, **p < 0.01 versus corresponding control group (Student's t-test).

Reprints and Corporate Permissions

Please note: Selecting permissions does not provide access to the full text of the article, please see our help page How do I view content?

To request a reprint or corporate permissions for this article, please click on the relevant link below:

Academic Permissions

Please note: Selecting permissions does not provide access to the full text of the article, please see our help page How do I view content?

Obtain permissions instantly via Rightslink by clicking on the button below:

If you are unable to obtain permissions via Rightslink, please complete and submit this Permissions form. For more information, please visit our Permissions help page.