Publication Cover
Stress
The International Journal on the Biology of Stress
Volume 15, 2012 - Issue 4
214
Views
10
CrossRef citations to date
0
Altmetric
Original Research Reports

Induction of arginine vasopressin-enhanced green fluorescent protein expression in the locus coeruleus following kainic acid-induced seizures in rats

, , , , , , , , & show all
Pages 435-442 | Received 11 May 2011, Accepted 22 Sep 2011, Published online: 05 Dec 2011

Figures & data

Figure 1.  Time course of seizure scale (stage) of KA-induced seizures. Values represent means ± SEM.
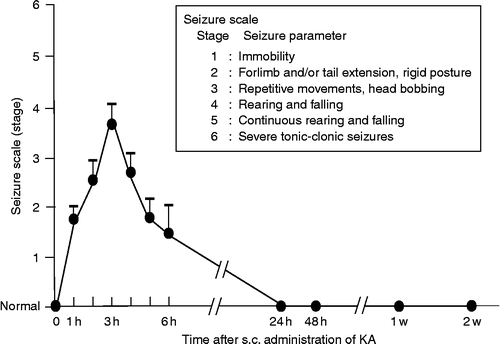
Figure 1.  Time course of seizure scale (stage) of KA-induced seizures. Values represent means ± SEM.

Figure 2.  Effects of s.c. administration of vehicle or KA on eGFP fluorescence in (A-a∼g) the LC, (B-a∼g) the NTS, (C-a∼g) the VLM, and (D-a∼g) the AM. Sections (A-a, B-a, C-a, D-a) were obtained from animals 24 h after s.c. administration of vehicle. Scale bars = 200 μm.
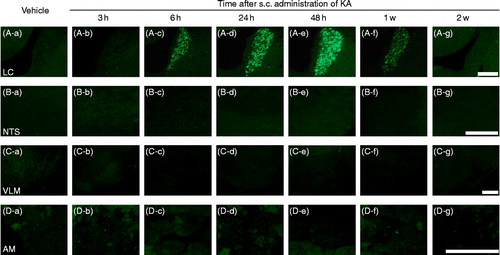
Figure 2.  Effects of s.c. administration of vehicle or KA on eGFP fluorescence in (A-a∼g) the LC, (B-a∼g) the NTS, (C-a∼g) the VLM, and (D-a∼g) the AM. Sections (A-a, B-a, C-a, D-a) were obtained from animals 24 h after s.c. administration of vehicle. Scale bars = 200 μm.

Figure 3.  Time course of eGFP fluorescence in the LC after s.c. administration of vehicle or KA. **p < 0.01, *p < 0.05 compared with vehicle. Values represent means ± SEM. Number of rats at each point; vehicle (n = 4), 3 h (n = 4), 6 h (n = 5), 24 h (n = 5), 48 h (n = 5), 1 week (n = 6), and 2 weeks (n = 4). Mean density (100% of control) was calculated from the sections obtained from animals 24 h after s.c. administration of vehicle. Statistical significance was determined by one-way ANOVA, following by Holm correction for multiple comparisons (F = 10.781, p < 0.0001).
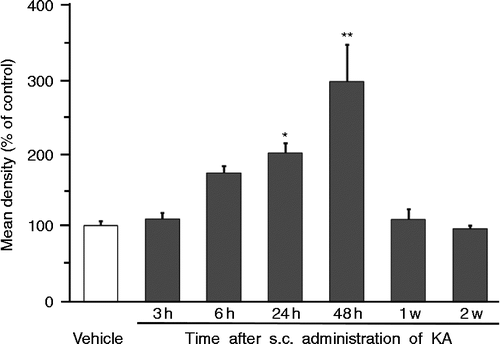
Figure 3.  Time course of eGFP fluorescence in the LC after s.c. administration of vehicle or KA. **p < 0.01, *p < 0.05 compared with vehicle. Values represent means ± SEM. Number of rats at each point; vehicle (n = 4), 3 h (n = 4), 6 h (n = 5), 24 h (n = 5), 48 h (n = 5), 1 week (n = 6), and 2 weeks (n = 4). Mean density (100% of control) was calculated from the sections obtained from animals 24 h after s.c. administration of vehicle. Statistical significance was determined by one-way ANOVA, following by Holm correction for multiple comparisons (F = 10.781, p < 0.0001).

Figure 4.  Effects of s.c. administration of vehicle or KA (12 mg/kg) with pretreatment of vehicle or MK-801 (1 mg/kg) on eGFP fluorescence in the LC. Sections were obtained from (A) vehicle-administered rats pretreated with vehicle or (B) MK-801 (1 mg/kg) and (C) KA-administered rats pretreated with vehicle or (D) MK-801 (1 mg/kg). Scale bar = 50 μm. 4 V, fourth ventricle.
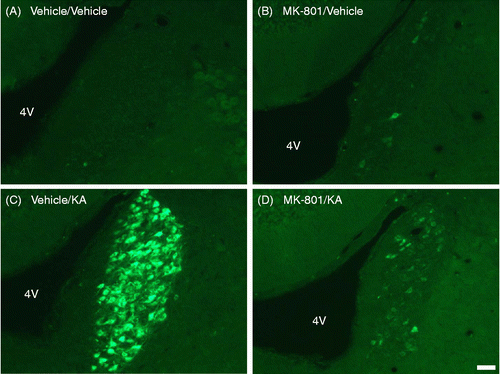
Figure 4.  Effects of s.c. administration of vehicle or KA (12 mg/kg) with pretreatment of vehicle or MK-801 (1 mg/kg) on eGFP fluorescence in the LC. Sections were obtained from (A) vehicle-administered rats pretreated with vehicle or (B) MK-801 (1 mg/kg) and (C) KA-administered rats pretreated with vehicle or (D) MK-801 (1 mg/kg). Scale bar = 50 μm. 4 V, fourth ventricle.

Figure 5.  Effect of s.c. administration of vehicle or KA (12 mg/kg) with pretreatment of vehicle or MK-801 (1 mg/kg) on eGFP fluorescence in the LC. **p < 0.01 compared with KA-administered rats pretreated with vehicle. Values represent means ± SEM. Number of rat: vehicle+vehicle (n = 3), MK-801+vehicle (n = 3), vehicle+KA (n = 7), and MK-801+KA (n = 5). Statistical significance was determined by one-way ANOVA, following by Bonferroni correction for multiple comparisons (F = 22.957, p < 0.0001).
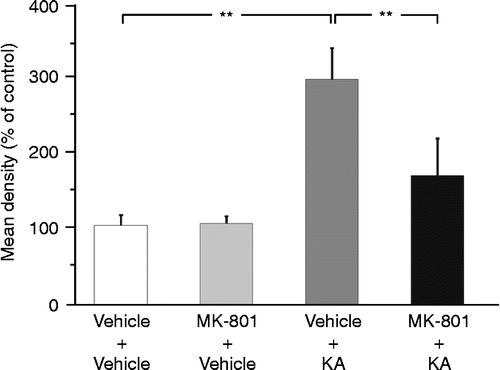
Figure 5.  Effect of s.c. administration of vehicle or KA (12 mg/kg) with pretreatment of vehicle or MK-801 (1 mg/kg) on eGFP fluorescence in the LC. **p < 0.01 compared with KA-administered rats pretreated with vehicle. Values represent means ± SEM. Number of rat: vehicle+vehicle (n = 3), MK-801+vehicle (n = 3), vehicle+KA (n = 7), and MK-801+KA (n = 5). Statistical significance was determined by one-way ANOVA, following by Bonferroni correction for multiple comparisons (F = 22.957, p < 0.0001).

Figure 6.  Effect of s.c. administration of vehicle (control) or KA (12 mg/kg) on (A, D) eGFP fluorescence and (B, E) TH-immunoreactivity in the LC. (B, E) TH-antibody complexes were visualized as red fluorescence, using Alexa Fluor 546-conjugated secondary antibody. (C, F) Merged view of fluorescence of eGFP and Alex Fluor 546 is seen as yellow. Sections were obtained from (A–C) control or (D–F) KA-treated rats. Boxed areas are enlarged in D, E, and F. Scale bars = 50 μm.
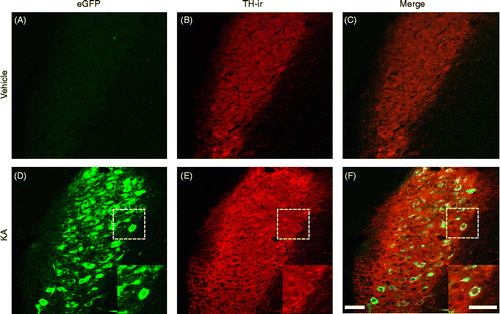
Figure 6.  Effect of s.c. administration of vehicle (control) or KA (12 mg/kg) on (A, D) eGFP fluorescence and (B, E) TH-immunoreactivity in the LC. (B, E) TH-antibody complexes were visualized as red fluorescence, using Alexa Fluor 546-conjugated secondary antibody. (C, F) Merged view of fluorescence of eGFP and Alex Fluor 546 is seen as yellow. Sections were obtained from (A–C) control or (D–F) KA-treated rats. Boxed areas are enlarged in D, E, and F. Scale bars = 50 μm.

Reprints and Corporate Permissions

Please note: Selecting permissions does not provide access to the full text of the article, please see our help page How do I view content?

To request a reprint or corporate permissions for this article, please click on the relevant link below:

Academic Permissions

Please note: Selecting permissions does not provide access to the full text of the article, please see our help page How do I view content?

Obtain permissions instantly via Rightslink by clicking on the button below:

If you are unable to obtain permissions via Rightslink, please complete and submit this Permissions form. For more information, please visit our Permissions help page.