Publication Cover
Stress
The International Journal on the Biology of Stress
Volume 16, 2013 - Issue 1
1,085
Views
69
CrossRef citations to date
0
Altmetric
Research Article

Involvement of oxidative stress and mitogen-activated protein kinase signaling pathways in heat stress-induced injury in the rat small intestine

, , , , , , , , , , & show all
Pages 99-113 | Received 08 Mar 2011, Accepted 26 Mar 2012, Published online: 09 May 2012

Figures & data

Figure 1.  Gross morphology of control and heat-treated rat small intestine on the 3rd day of heat treatment. (A) Edema, hyperemia, and petechial hemorrhages in the mesentery are clearly visible (arrow) in response to heat treatment (40°C for 2 h per day). (B) Photomicrographs of hematoxylin and eosin-stained sections of rat small intestine after 3 days of heat treatment. Upper panels are small intestine from control rats, lower panels are small intestine from heat-stressed rats. Panels (a) and (d) illustrate duodenum sections; (b) and (e) jejunum sections; (c) and (f) ileum sections. Abnormal microstructures are indicated by arrows with numbers. Severe damage to the intestinal villi by heat treatment is apparent, with hyperemia (indicated by 2, 3, 6, and 7) desquamation at the tips of the intestinal villi (1, 5, and 9), and exposure of the lamina propria (4 and 8). Scale bar represents 100 μm.
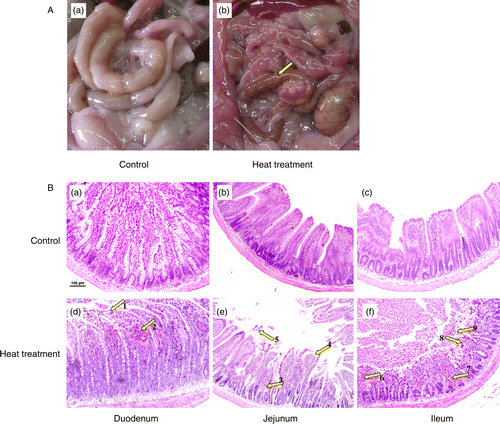
Figure 1.  Gross morphology of control and heat-treated rat small intestine on the 3rd day of heat treatment. (A) Edema, hyperemia, and petechial hemorrhages in the mesentery are clearly visible (arrow) in response to heat treatment (40°C for 2 h per day). (B) Photomicrographs of hematoxylin and eosin-stained sections of rat small intestine after 3 days of heat treatment. Upper panels are small intestine from control rats, lower panels are small intestine from heat-stressed rats. Panels (a) and (d) illustrate duodenum sections; (b) and (e) jejunum sections; (c) and (f) ileum sections. Abnormal microstructures are indicated by arrows with numbers. Severe damage to the intestinal villi by heat treatment is apparent, with hyperemia (indicated by 2, 3, 6, and 7) desquamation at the tips of the intestinal villi (1, 5, and 9), and exposure of the lamina propria (4 and 8). Scale bar represents 100 μm.

Figure 2.  Intestinal permeability of control and heat-stressed rats was assessed using FITC-dextran in vivo on Days 1, 3, 6, and 10. Heat treatment comprised exposure to 40°C for 2 h, on 10 consecutive days. Data are mean ± SEM, n = 3 rats per group and day. *p < 0.05 compared to control, one-way ANOVA.
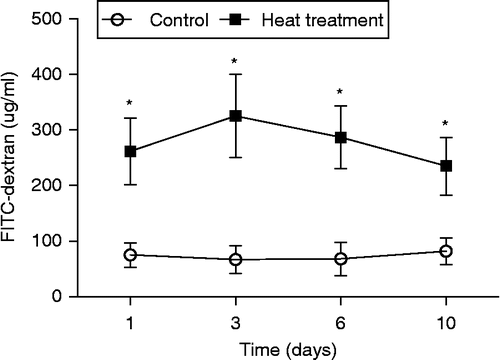
Figure 2.  Intestinal permeability of control and heat-stressed rats was assessed using FITC-dextran in vivo on Days 1, 3, 6, and 10. Heat treatment comprised exposure to 40°C for 2 h, on 10 consecutive days. Data are mean ± SEM, n = 3 rats per group and day. *p < 0.05 compared to control, one-way ANOVA.

Figure 3.  SEM and TEM of the small intestine (jejunum) from rats subjected to control conditions or heat treatment (40°C for 2 h per day) for 3 days. Abnormal microstructures are indicated with arrows with numbers. (A) Mucosal surface of the small intestine was visualized using a scanning electron microscope (scale bar divisions represent 10 μm). Heat stress caused: loss of the upper portion of the intestinal villi (indicated by 2), some epithelial cells to separate from the lamina propria (1), the reticular fibers to become exposed after exuviation of intestinal epithelial cells (2), and erythrocytes were able to enter the lumen (3). (B) Ultrastructure of the jejunum examined using a transmission electron microscope. Changes in microvillus height (3, 7, and 8), mitochondria (6), endoplasmic reticulum and nuclei (1, 2, and 5) were apparent when compared to control sections. Vacuolization was also visible in the epithelium of heat-stressed rats (4), associated with a progressive loss of epithelial cells from the basement membrane. In (B), scale bars represent 20, 10, and 0.5 μm from left to right, respectively.
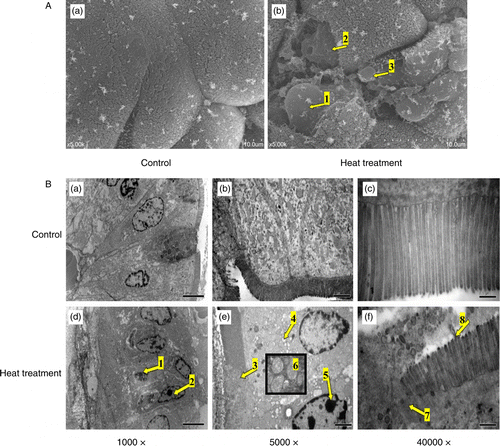
Figure 3.  SEM and TEM of the small intestine (jejunum) from rats subjected to control conditions or heat treatment (40°C for 2 h per day) for 3 days. Abnormal microstructures are indicated with arrows with numbers. (A) Mucosal surface of the small intestine was visualized using a scanning electron microscope (scale bar divisions represent 10 μm). Heat stress caused: loss of the upper portion of the intestinal villi (indicated by 2), some epithelial cells to separate from the lamina propria (1), the reticular fibers to become exposed after exuviation of intestinal epithelial cells (2), and erythrocytes were able to enter the lumen (3). (B) Ultrastructure of the jejunum examined using a transmission electron microscope. Changes in microvillus height (3, 7, and 8), mitochondria (6), endoplasmic reticulum and nuclei (1, 2, and 5) were apparent when compared to control sections. Vacuolization was also visible in the epithelium of heat-stressed rats (4), associated with a progressive loss of epithelial cells from the basement membrane. In (B), scale bars represent 20, 10, and 0.5 μm from left to right, respectively.

Figure 4.  The oxidative state of rat small intestine following heat treatment was determined by measuring ROS and RNS, MDA, SOD, and GSH-px. The production of ROS/RNS (A) and the concentration of MDA (B) in rat small intestine (duodenum, jejunum, and ileum) were both significantly increased; activities of the antioxidant enzymes (C) SOD and (D) GSH-px were significantly reduced in response to heat treatment. Data are mean ± SEM, n = 6 per treatment. *p < 0.05 compared to control, Student's t-test. (E) Photomicrographs of intracellular ROS in rat IEC-6 cells. Increased green dichlorofluorescein (DCF, indicator of intracellular ROS production) fluorescence (right panel, arrow) indicates increased intracellular ROS production in IEC-6 cells after heat treatment at 42°C for 3 h. Scale bar represents 100 μm.
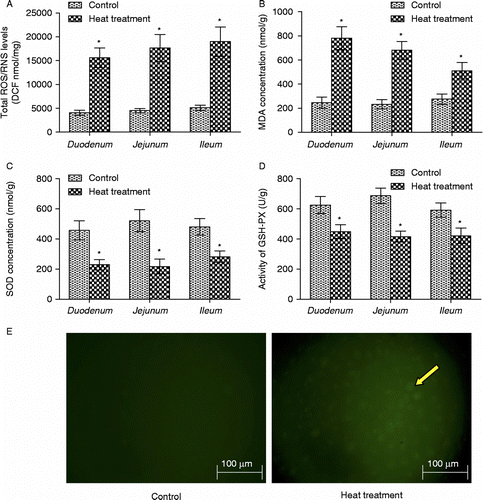
Figure 4.  The oxidative state of rat small intestine following heat treatment was determined by measuring ROS and RNS, MDA, SOD, and GSH-px. The production of ROS/RNS (A) and the concentration of MDA (B) in rat small intestine (duodenum, jejunum, and ileum) were both significantly increased; activities of the antioxidant enzymes (C) SOD and (D) GSH-px were significantly reduced in response to heat treatment. Data are mean ± SEM, n = 6 per treatment. *p < 0.05 compared to control, Student's t-test. (E) Photomicrographs of intracellular ROS in rat IEC-6 cells. Increased green dichlorofluorescein (DCF, indicator of intracellular ROS production) fluorescence (right panel, arrow) indicates increased intracellular ROS production in IEC-6 cells after heat treatment at 42°C for 3 h. Scale bar represents 100 μm.

Figure 5.  Immunohistochemical analysis of phospho-ERK1/2, phospho-JNK and phospho-p38 MAPK expression in the small intestine (jejunum) crypts of rats subjected to 3 days of heat treatment (40°C for 2 h per day) or control conditions. Phosphorylation of ERK1/2, JNK, and p38 MAPK were all increased (brown stain, arrows; sections counterstained with hematoxylin, light purple) in response to heat treatment above control levels. Scale bar represents 20 μm.
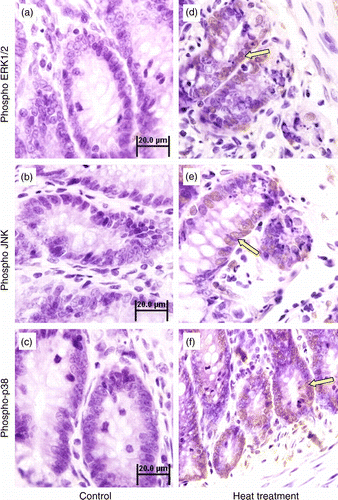
Figure 5.  Immunohistochemical analysis of phospho-ERK1/2, phospho-JNK and phospho-p38 MAPK expression in the small intestine (jejunum) crypts of rats subjected to 3 days of heat treatment (40°C for 2 h per day) or control conditions. Phosphorylation of ERK1/2, JNK, and p38 MAPK were all increased (brown stain, arrows; sections counterstained with hematoxylin, light purple) in response to heat treatment above control levels. Scale bar represents 20 μm.

Figure 6.  Quantification of western-blot determination of phospho-ERK1/2, phospho-JNK, and phospho-p38 MAPK in sections of small intestine collected from control and heat-treated rats on the 3rd day of treatment (40°C for 2 h per day). Phosphorylation of (A) ERK1/2, (B) JNK, and (C) p38 were all significantly elevated in heat-treated rats. Values are expressed as the percentage of control. Data are mean ± SEM, n = 6 per treatment. *p < 0.05 compared to control, Student's t-test.
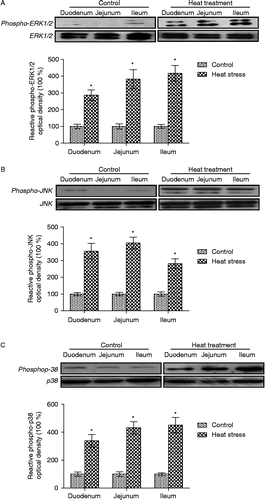
Figure 6.  Quantification of western-blot determination of phospho-ERK1/2, phospho-JNK, and phospho-p38 MAPK in sections of small intestine collected from control and heat-treated rats on the 3rd day of treatment (40°C for 2 h per day). Phosphorylation of (A) ERK1/2, (B) JNK, and (C) p38 were all significantly elevated in heat-treated rats. Values are expressed as the percentage of control. Data are mean ± SEM, n = 6 per treatment. *p < 0.05 compared to control, Student's t-test.

Figure 7.  Photomicrographs of rat IEC-6 cells demonstrating gross changes in cellular morphology in response to heat stress and in combination with specific MAPK inhibitors. Cellular morphology was markedly altered following heat treatment (42°C for 3 h), with changes in cell shape (arrows) and a greater number of dead cells in the supernatant. This effect was exacerbated by pretreating cells with U0126 (extracellular signal-regulated kinase, ERK1/2, inhibitor), but attenuated by pretreating cells with SP600125 (c-Jun N-terminal kinase, JNK, inhibitor) or SB203580 (p38 inhibitor). Scale bar represents 100 μm.
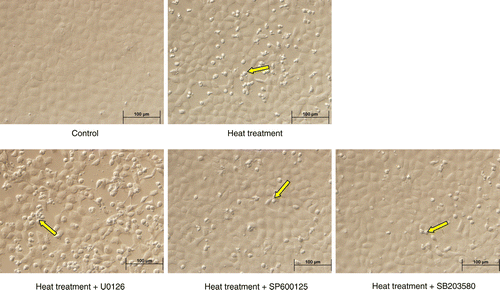
Figure 7.  Photomicrographs of rat IEC-6 cells demonstrating gross changes in cellular morphology in response to heat stress and in combination with specific MAPK inhibitors. Cellular morphology was markedly altered following heat treatment (42°C for 3 h), with changes in cell shape (arrows) and a greater number of dead cells in the supernatant. This effect was exacerbated by pretreating cells with U0126 (extracellular signal-regulated kinase, ERK1/2, inhibitor), but attenuated by pretreating cells with SP600125 (c-Jun N-terminal kinase, JNK, inhibitor) or SB203580 (p38 inhibitor). Scale bar represents 100 μm.

Figure 8.  Apoptosis in rat IEC-6 cells. Apoptosis was determined by annexin V/PI staining and flow cytometry following heat stress and in combination with specific MAPK inhibitors. Cell apoptosis was strikingly increased after heat stress (42°C for 3 h). Heat stress induced-apoptosis was augmented by U0126 (extracellular signal-regulated kinase, ERK1/2, inhibitor) pretreatment, but attenuated by SP600125 (c-Jun N-terminal kinase, JNK, inhibitor) and SB203580 (p38 inhibitor) pretreatment. (A) Flow cytometry data per treatment. G1 (Annexin 744 V − /PI+) represents percentage of necrotic cells; G2 (Annexin V+/PI+) percentage of late apoptosis cells; G3 (Annexin V − /PI − ) percentage of live cells; G4 (Annexin V+/PI − ) percentage of early apoptotic cells. (B) Total apoptotic cells (percentage) = early apoptotic cells (G4) + late apoptosis cells (G2). Data are mean ± SEM, n = 3 per treatment. *p < 0.05 compared to control, # p < 0.05 compared to heat treatment, one-way ANOVA.
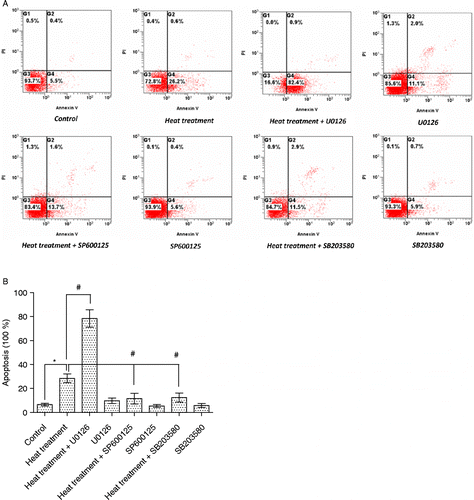
Figure 8.  Apoptosis in rat IEC-6 cells. Apoptosis was determined by annexin V/PI staining and flow cytometry following heat stress and in combination with specific MAPK inhibitors. Cell apoptosis was strikingly increased after heat stress (42°C for 3 h). Heat stress induced-apoptosis was augmented by U0126 (extracellular signal-regulated kinase, ERK1/2, inhibitor) pretreatment, but attenuated by SP600125 (c-Jun N-terminal kinase, JNK, inhibitor) and SB203580 (p38 inhibitor) pretreatment. (A) Flow cytometry data per treatment. G1 (Annexin 744 V − /PI+) represents percentage of necrotic cells; G2 (Annexin V+/PI+) percentage of late apoptosis cells; G3 (Annexin V − /PI − ) percentage of live cells; G4 (Annexin V+/PI − ) percentage of early apoptotic cells. (B) Total apoptotic cells (percentage) = early apoptotic cells (G4) + late apoptosis cells (G2). Data are mean ± SEM, n = 3 per treatment. *p < 0.05 compared to control, # p < 0.05 compared to heat treatment, one-way ANOVA.
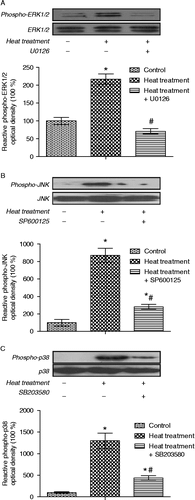
Figure 9.  Quantification of immunoblot densities for phospho-ERK1/2, phospho-JNK and phospho-p38 MAPK in rat IEC-6 cells. Phosphorylation levels of ERK1/2, JNK, and p38 were significantly increased after heat treatment (42°C for 3 h); these increases were blocked by pretreatment with specific MAPK inhibitors (U0126, SP600125, and SB203580, respectively, inhibitors of ERK1/2, JNK, and p38). Values are percentage of control. Data are mean ± SEM, n = 6 per treatment. *p < 0.05 compared to control, # p < 0.05 compared to heat treatment, one-way ANOVA.

Figure 9.  Quantification of immunoblot densities for phospho-ERK1/2, phospho-JNK and phospho-p38 MAPK in rat IEC-6 cells. Phosphorylation levels of ERK1/2, JNK, and p38 were significantly increased after heat treatment (42°C for 3 h); these increases were blocked by pretreatment with specific MAPK inhibitors (U0126, SP600125, and SB203580, respectively, inhibitors of ERK1/2, JNK, and p38). Values are percentage of control. Data are mean ± SEM, n = 6 per treatment. *p < 0.05 compared to control, # p < 0.05 compared to heat treatment, one-way ANOVA.
Supplemental material

Supplementary Material

Download MS Word (34.5 KB)

Reprints and Corporate Permissions

Please note: Selecting permissions does not provide access to the full text of the article, please see our help page How do I view content?

To request a reprint or corporate permissions for this article, please click on the relevant link below:

Academic Permissions

Please note: Selecting permissions does not provide access to the full text of the article, please see our help page How do I view content?

Obtain permissions instantly via Rightslink by clicking on the button below:

If you are unable to obtain permissions via Rightslink, please complete and submit this Permissions form. For more information, please visit our Permissions help page.