Publication Cover
Stress
The International Journal on the Biology of Stress
Volume 16, 2013 - Issue 1
632
Views
41
CrossRef citations to date
0
Altmetric
Research Article

Chronic exposure to stress hormones promotes transformation and tumorigenicity of 3T3 mouse fibroblasts

, , , , , & show all
Pages 114-121 | Received 06 Dec 2011, Accepted 14 Apr 2012, Published online: 16 May 2012

Figures & data

Figure 1.  Effect of 24-h exposure to stress hormones on DNA damage. NIH 3T3 cells were incubated in the presence or absence of (A) epinephrine or (B) norepinephrine for 24 h, and DNA damage was measured by the comet assay. In some experiments, cells were pre-treated for 30 min with 10− 6 M propranolol prior to treatment with the stress hormones. Results are expressed as mean% tail intensity ± SD. Asterisk (*) indicates the significant increase compared to that of untreated control (p < 0.05) using a one-way ANOVA with Tukey's post-hoc analyses. Each experiment was performed twice, and 100 cells were analyzed in each comet assay. Prop, propranolol; Epi, epinephrine; NE, norepinephrine.
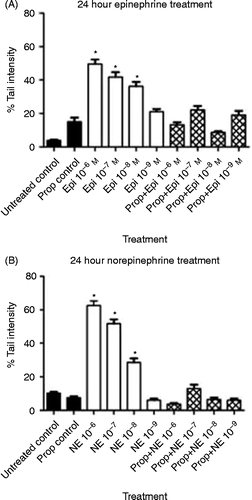
Figure 1.  Effect of 24-h exposure to stress hormones on DNA damage. NIH 3T3 cells were incubated in the presence or absence of (A) epinephrine or (B) norepinephrine for 24 h, and DNA damage was measured by the comet assay. In some experiments, cells were pre-treated for 30 min with 10− 6 M propranolol prior to treatment with the stress hormones. Results are expressed as mean% tail intensity ± SD. Asterisk (*) indicates the significant increase compared to that of untreated control (p < 0.05) using a one-way ANOVA with Tukey's post-hoc analyses. Each experiment was performed twice, and 100 cells were analyzed in each comet assay. Prop, propranolol; Epi, epinephrine; NE, norepinephrine.

Figure 2.  Photographs of NIH 3T3 cells following comet assay. NIH 3T3 cells were untreated or treated (24 h) with stress hormones (epinephrine or norepinephrine) at 10− 7 M in the presence or absence of 10− 6 M propranolol. Arrows point to examples of comet tails. All pictures were taken at 50 × . Bars equal 50 μm. Epi, epinephrine; Norepi, norepinephrine; Prop, propranolol.
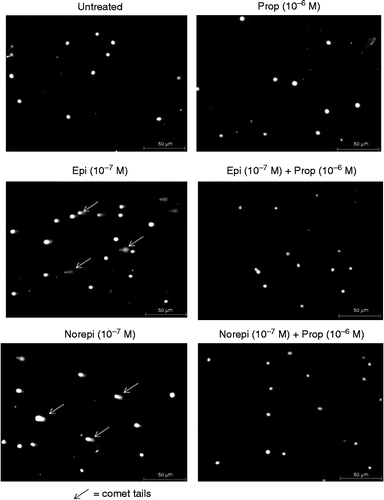
Figure 2.  Photographs of NIH 3T3 cells following comet assay. NIH 3T3 cells were untreated or treated (24 h) with stress hormones (epinephrine or norepinephrine) at 10− 7 M in the presence or absence of 10− 6 M propranolol. Arrows point to examples of comet tails. All pictures were taken at 50 × . Bars equal 50 μm. Epi, epinephrine; Norepi, norepinephrine; Prop, propranolol.

Figure 3.  Effect of 24-h exposure to stress hormones on DNA damage followed by a 7-day rest period. NIH 3T3 cells were incubated in the presence or absence of (A) epinephrine or (B) norepinephrine for 24 h, followed by a 7-day rest period, and DNA damage was measured by the comet assay. In some experiments, cells were pre-incubated for 30 min with 10− 6 M propranolol. Each experiment was performed twice, and 100 cells were analyzed in each comet assay. Results are expressed as mean% tail intensity ± SD. No significant differences were found with one-way ANOVA. Pro, propranolol; Epi, epinephrine; NE, norepinephrine.
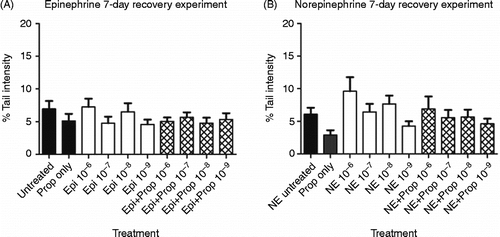
Figure 3.  Effect of 24-h exposure to stress hormones on DNA damage followed by a 7-day rest period. NIH 3T3 cells were incubated in the presence or absence of (A) epinephrine or (B) norepinephrine for 24 h, followed by a 7-day rest period, and DNA damage was measured by the comet assay. In some experiments, cells were pre-incubated for 30 min with 10− 6 M propranolol. Each experiment was performed twice, and 100 cells were analyzed in each comet assay. Results are expressed as mean% tail intensity ± SD. No significant differences were found with one-way ANOVA. Pro, propranolol; Epi, epinephrine; NE, norepinephrine.

Figure 4.  Effect of 24-h exposure to stress hormones on cell transformation. NIH 3T3 cells were incubated in the presence or absence of epinephrine (Epi) or norepinephrine (10− 7 M) for (A) 24 h or (B) 24 h followed by a 7-day rest period, and the transformed phenotype was measured by a soft agar colony assay. In some experiments, cells were pre-incubated for 30 min with 10− 6 M propranolol. Each experiment was performed twice. Results are expressed as mean ± SD. Asterisk (*) indicates the significant increase compared with that of untreated control (p < 0.05) using a one-way ANOVA with Tukey's post-hoc analyses. Epi, epinephrine.
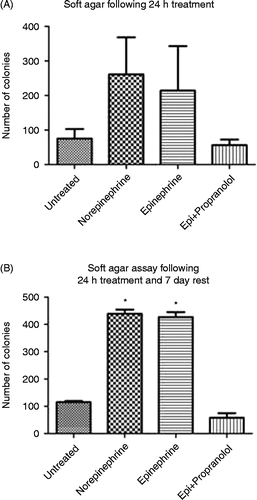
Figure 4.  Effect of 24-h exposure to stress hormones on cell transformation. NIH 3T3 cells were incubated in the presence or absence of epinephrine (Epi) or norepinephrine (10− 7 M) for (A) 24 h or (B) 24 h followed by a 7-day rest period, and the transformed phenotype was measured by a soft agar colony assay. In some experiments, cells were pre-incubated for 30 min with 10− 6 M propranolol. Each experiment was performed twice. Results are expressed as mean ± SD. Asterisk (*) indicates the significant increase compared with that of untreated control (p < 0.05) using a one-way ANOVA with Tukey's post-hoc analyses. Epi, epinephrine.

Figure 5.  Effect of stress hormones on tumor progression of NIH 3T3 cells. NIH 3T3 cells were incubated in the presence or absence of epinephrine or norepinephrine (10− 6 M) for 24 h, trypsinized, and 5 × 10⁵ cells were injected subcutaneously into the flanks of Balb/c nude mice (four mice per group). Results are presented as mean tumor volume ± SD; mice were removed from study if tumor volume reached 4 cm3. Asterisk (*) indicates the significant increase compared with that of control (p = 0.01) using a repeated measures ANOVA.
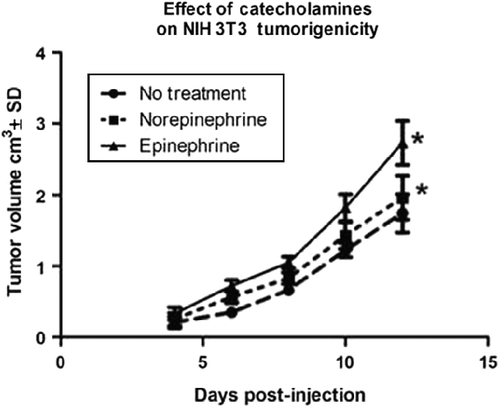
Figure 5.  Effect of stress hormones on tumor progression of NIH 3T3 cells. NIH 3T3 cells were incubated in the presence or absence of epinephrine or norepinephrine (10− 6 M) for 24 h, trypsinized, and 5 × 10⁵ cells were injected subcutaneously into the flanks of Balb/c nude mice (four mice per group). Results are presented as mean tumor volume ± SD; mice were removed from study if tumor volume reached 4 cm3. Asterisk (*) indicates the significant increase compared with that of control (p = 0.01) using a repeated measures ANOVA.

Reprints and Corporate Permissions

Please note: Selecting permissions does not provide access to the full text of the article, please see our help page How do I view content?

To request a reprint or corporate permissions for this article, please click on the relevant link below:

Academic Permissions

Please note: Selecting permissions does not provide access to the full text of the article, please see our help page How do I view content?

Obtain permissions instantly via Rightslink by clicking on the button below:

If you are unable to obtain permissions via Rightslink, please complete and submit this Permissions form. For more information, please visit our Permissions help page.