Figures & data
Figure 1. Maternal cortisol response profiles in venous blood samples from pregnant sheep exposed to repeated isolation stress for 3 h twice a week in early gestation [30–100 days gestation (dGA), n = 18]. Data are mean ± SEM; *P < 0.001, 30 dGA vs. 88 dGA; # P < 0.001, 30 dGA vs. the following dGA; $ represents all groups, P < 0.001, − 30 min vs. 15 min; Friedman's ANOVA and/or Wilcoxon paired test.
![Figure 1. Maternal cortisol response profiles in venous blood samples from pregnant sheep exposed to repeated isolation stress for 3 h twice a week in early gestation [30–100 days gestation (dGA), n = 18]. Data are mean ± SEM; *P < 0.001, 30 dGA vs. 88 dGA; # P < 0.001, 30 dGA vs. the following dGA; $ represents all groups, P < 0.001, − 30 min vs. 15 min; Friedman's ANOVA and/or Wilcoxon paired test.](/cms/asset/16a19b5f-30cd-4daf-aa1d-1dc1a7ff5a77/ists_a_686541_f0001_b.gif)
Figure 2. Integrated maternal cortisol response in pregnant sheep exposed to repeated isolation stress for 3 h twice a week at selected isolation bouts in early [30–100 days gestation (dGA), n = 18] and late (100–120 dGA, n = 7) gestation. Data are mean ± SEM; *P < 0.001 compared to baseline; # P < 0.001 compared to 30 dGA; § P < 0.001 compared to later gestational ages; Wilcoxon paired test.
![Figure 2. Integrated maternal cortisol response in pregnant sheep exposed to repeated isolation stress for 3 h twice a week at selected isolation bouts in early [30–100 days gestation (dGA), n = 18] and late (100–120 dGA, n = 7) gestation. Data are mean ± SEM; *P < 0.001 compared to baseline; # P < 0.001 compared to 30 dGA; § P < 0.001 compared to later gestational ages; Wilcoxon paired test.](/cms/asset/b1eb4d43-2b42-4f0f-a098-d85f9176aefa/ists_a_686541_f0002_b.gif)
Table I. Fetal physiological parameters before hypotensive challenge.
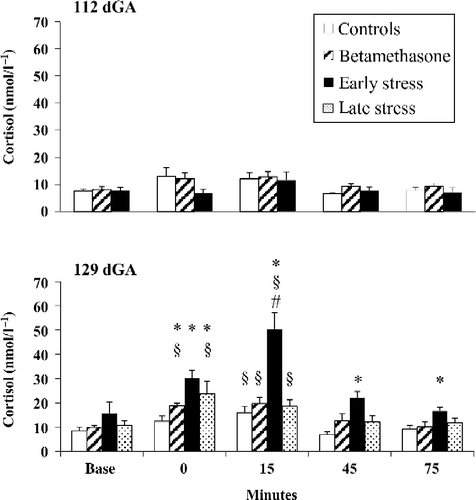
Figure 3. Fetal carotid arterial blood cortisol responses to hypotensive challenge induced by fetal jugular vein infusion of SNP at 112 and 129 days gestation (dGA) in controls (n = 7), early (30–100 dGA, n = 7), and late (100–120 dGA, n = 7) isolation stressed ewes, and following maternal BM administration at 106/107 and 112/113 dGA (n = 7). Data are mean ± SEM; *P < 0.05 compared to controls; § P < 0.05 compared to baseline; # P < 0.05 compared to control, late stress, or BM groups, 15 min after the end of SNP infusion; Kruskal–Wallis ANOVA, Mann–Whitney U-test, and/or Wilcoxon paired test.

Table II. Fetal physiological parameters during hypotensive challenge.
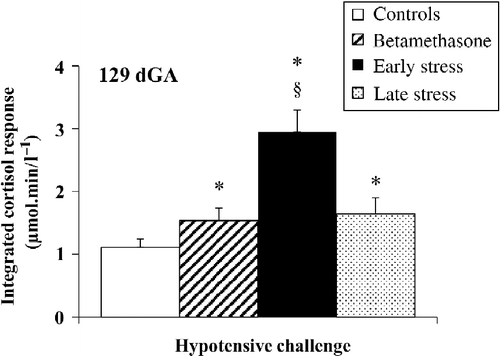
Figure 4. Integrated fetal carotid arterial blood cortisol responses to hypotensive challenge at 129 days gestation (dGA) induced by fetal jugular vein infusion of SNP in controls (n = 7), early (30–100 dGA, n = 7), and late (100–120 dGA, n = 7) isolation stressed ewes, and following BM administration at 106/107 and 112/113 dGA (n = 7). Data are mean ± SEM; *P < 0.05 compared to controls; § P < 0.05 compared to late stress or BM; Kruskal–Wallis ANOVA and Mann–Whitney U-test.
