Publication Cover
Stress
The International Journal on the Biology of Stress
Volume 16, 2013 - Issue 1
833
Views
8
CrossRef citations to date
0
Altmetric
Research Article

Increased insulin secretion and decreased glucose concentrations, but not allostatic load, are associated with stress-related exhaustion in a clinical patient population

, , &
Pages 24-33 | Received 15 Aug 2011, Accepted 20 Apr 2012, Published online: 04 Jun 2012

Figures & data

Table I.  Demographic factors for patients with stress-related exhaustion and controls.

Table II.  Quartile distributions of all biomarkers and AL scores in patients with stress-related exhaustion and controls.

Table III.  Results from the MANOVA performed to test differences between patients with stress-related exhaustion and controls for each of the 13 biomarkers.

Table IV.  Separate analyses for men and women showing the results from the MANOVA performed to test differences between patients with stress-related exhaustion and controls for each of the 13 biomarkers.

Figure 1.  Two clusters were identified by multivariate analysis, including all 13 AL markers and 87 patients with stress-related exhaustion and 83 controls. (a) Relative importance of each AL biomarker for the two clusters and for the total model. (b) Characteristics of the two clusters illustrated by cluster mean values of standardized AL biomarker data; each biomarker has mean 0 and SD 1. Low AL (Cluster 1), n = 68 participants (29 patients; 39 controls); High AL (Cluster 2), n = 102 participants (58 patients; 44 controls). Note, total n = 170 participants as there was a missing Biomarker value for 10 of the original 180 participants. AL markers: BMI, body mass index; WHR, waist–hip ratio; SBP, systolic blood pressure; DBP, diastolic blood pressure; HDL, serum high-density lipoprotein; TC, serum total cholesterol; LDL, serum low-density lipoprotein; triglycerides, serum concentration; CRP, serum C-reactive protein; insulin, serum concentration; glucose, plasma concentration; HbA1c, blood glycated haemoglobin; cortisol, mean morning salivary concentration.
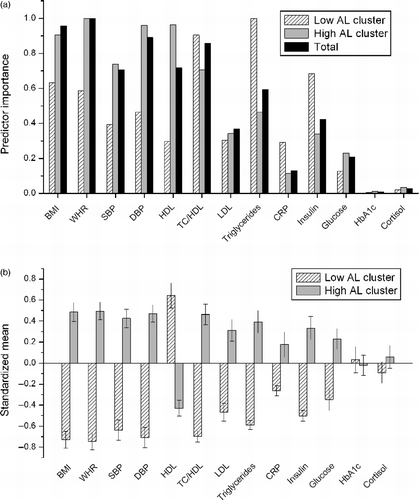
Figure 1.  Two clusters were identified by multivariate analysis, including all 13 AL markers and 87 patients with stress-related exhaustion and 83 controls. (a) Relative importance of each AL biomarker for the two clusters and for the total model. (b) Characteristics of the two clusters illustrated by cluster mean values of standardized AL biomarker data; each biomarker has mean 0 and SD 1. Low AL (Cluster 1), n = 68 participants (29 patients; 39 controls); High AL (Cluster 2), n = 102 participants (58 patients; 44 controls). Note, total n = 170 participants as there was a missing Biomarker value for 10 of the original 180 participants. AL markers: BMI, body mass index; WHR, waist–hip ratio; SBP, systolic blood pressure; DBP, diastolic blood pressure; HDL, serum high-density lipoprotein; TC, serum total cholesterol; LDL, serum low-density lipoprotein; triglycerides, serum concentration; CRP, serum C-reactive protein; insulin, serum concentration; glucose, plasma concentration; HbA1c, blood glycated haemoglobin; cortisol, mean morning salivary concentration.

Reprints and Corporate Permissions

Please note: Selecting permissions does not provide access to the full text of the article, please see our help page How do I view content?

To request a reprint or corporate permissions for this article, please click on the relevant link below:

Academic Permissions

Please note: Selecting permissions does not provide access to the full text of the article, please see our help page How do I view content?

Obtain permissions instantly via Rightslink by clicking on the button below:

If you are unable to obtain permissions via Rightslink, please complete and submit this Permissions form. For more information, please visit our Permissions help page.