Publication Cover
Stress
The International Journal on the Biology of Stress
Volume 16, 2013 - Issue 2
679
Views
37
CrossRef citations to date
0
Altmetric
Original Research Reports

Prenatal stress increases the obesogenic effects of a high-fat-sucrose diet in adult rats in a sex-specific manner

, , , , &
Pages 220-232 | Received 15 Nov 2011, Accepted 26 Jun 2012, Published online: 09 Aug 2012

Figures & data

Table I.  Schedule of variable stress during gestation.

Table II.  Body and food intake measurements in adult rats and statistical analysis of the groups.

Figure 1.  The effect of HFS diet intake and PNS on body fat mass gain in adult offspring. Results are group mean ± SEM. Different letters (a, b, and c) indicate significant differences p < 0.05, Post-hoc Bonferroni. (a) Males (n = 7–8), (b) Females (n = 8). C, Control; CE, Control stress; HFS, High-fat-sucrose; HFSE, High-fat-sucrose-stress; PNS, Prenatal stress; ns, not significant.
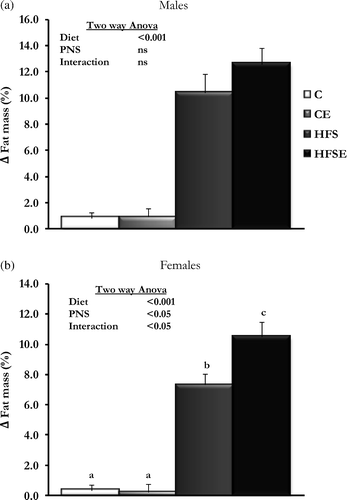
Figure 1.  The effect of HFS diet intake and PNS on body fat mass gain in adult offspring. Results are group mean ± SEM. Different letters (a, b, and c) indicate significant differences p < 0.05, Post-hoc Bonferroni. (a) Males (n = 7–8), (b) Females (n = 8). C, Control; CE, Control stress; HFS, High-fat-sucrose; HFSE, High-fat-sucrose-stress; PNS, Prenatal stress; ns, not significant.

Figure 2.  The effect of HFS diet intake and PNS on different WAT depots. Results are group mean ± SEM. Different letters (a, b, and c) indicate significant differences p < 0.05, post-hoc Bonferroni. (a) Males (n = 8), (b) Females (n = 8); C, Control, n = 8; CE, Control stress, n = 8; HFS, High-fat-sucrose, n = 8; HFSE, High-fat-sucrose-stress, n = 8; WAT, White adipose tissue; Rp, Retroperitoneal; Epi, Epididymal; Peri, Periovarian; Mes, Mesenteric; Sc, Subcutaneous; PNS, Prenatal stress; ns, not significant.
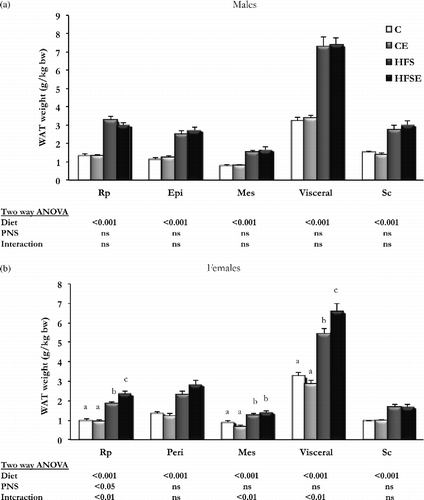
Figure 2.  The effect of HFS diet intake and PNS on different WAT depots. Results are group mean ± SEM. Different letters (a, b, and c) indicate significant differences p < 0.05, post-hoc Bonferroni. (a) Males (n = 8), (b) Females (n = 8); C, Control, n = 8; CE, Control stress, n = 8; HFS, High-fat-sucrose, n = 8; HFSE, High-fat-sucrose-stress, n = 8; WAT, White adipose tissue; Rp, Retroperitoneal; Epi, Epididymal; Peri, Periovarian; Mes, Mesenteric; Sc, Subcutaneous; PNS, Prenatal stress; ns, not significant.

Table III.  Biochemical measurements in serum in adulthood and statistical analysis of the groups.

Figure 3.  IPGTT conducted in female rats in the four experimental groups (n = 8 per group). Data are mean ± SEM, and were analyzed with RM-ANOVA. The results of each time point were analyzed with two-way ANOVA (Diet × PNS): When an interaction between two factors was observed (60 min point, p < 0.05; 90 min point, p < 0.01; 120 min point, p < 0.05), multiple comparisons were made with Student's t-test: #p < 0.05 versus C rats, €p < 0.05 versus HFS rats. C, Control; CS, Control stress; HFS, High-fat-sucrose; HFSE, High-fat-sucrose-stress; PNS, Prenatal stress, ns, not significant.Inset: AUC, area under the curve (n = 8 per group). Data are mean ± SEM, and were analyzed with two-way ANOVA (Diet × PNS).
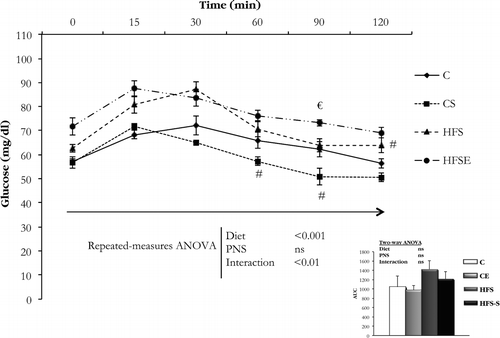
Figure 3.  IPGTT conducted in female rats in the four experimental groups (n = 8 per group). Data are mean ± SEM, and were analyzed with RM-ANOVA. The results of each time point were analyzed with two-way ANOVA (Diet × PNS): When an interaction between two factors was observed (60 min point, p < 0.05; 90 min point, p < 0.01; 120 min point, p < 0.05), multiple comparisons were made with Student's t-test: #p < 0.05 versus C rats, €p < 0.05 versus HFS rats. C, Control; CS, Control stress; HFS, High-fat-sucrose; HFSE, High-fat-sucrose-stress; PNS, Prenatal stress, ns, not significant.Inset: AUC, area under the curve (n = 8 per group). Data are mean ± SEM, and were analyzed with two-way ANOVA (Diet × PNS).

Figure 4.  The effect of HFS diet intake and PNS on corticosterone concentrations in female rats. Results are expressed by mean ± SEM. (a) Serum corticosterone concentration (n = 8). Data were analyzed with two-way ANOVA (Diet × PNS); (b) Fecal corticosterone content (24 h collection; n = 5–6 per group). Data were analyzed with RM-ANOVA. C, Control; CE, Control stress; HFS, High-fat-sucrose; HFSE, High-fat-sucrose-stress; PNS, Prenatal stress; ns, not significant.
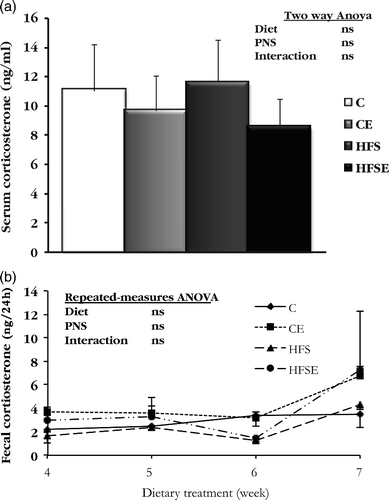
Figure 4.  The effect of HFS diet intake and PNS on corticosterone concentrations in female rats. Results are expressed by mean ± SEM. (a) Serum corticosterone concentration (n = 8). Data were analyzed with two-way ANOVA (Diet × PNS); (b) Fecal corticosterone content (24 h collection; n = 5–6 per group). Data were analyzed with RM-ANOVA. C, Control; CE, Control stress; HFS, High-fat-sucrose; HFSE, High-fat-sucrose-stress; PNS, Prenatal stress; ns, not significant.

Table IV.  Differentially expressed genes in Peri WAT related to obesity and glucocorticoid metabolism in adult female rats.

Supplemental material

Supplementary Material

Download PDF (145.6 KB)

Supplementary Material

Download PDF (679.3 KB)

Supplementary Material

Download PDF (530.4 KB)

Supplementary Material

Download MS Word (63 KB)

Supplementary Material

Download MS Word (132.5 KB)

Reprints and Corporate Permissions

Please note: Selecting permissions does not provide access to the full text of the article, please see our help page How do I view content?

To request a reprint or corporate permissions for this article, please click on the relevant link below:

Academic Permissions

Please note: Selecting permissions does not provide access to the full text of the article, please see our help page How do I view content?

Obtain permissions instantly via Rightslink by clicking on the button below:

If you are unable to obtain permissions via Rightslink, please complete and submit this Permissions form. For more information, please visit our Permissions help page.