Publication Cover
Stress
The International Journal on the Biology of Stress
Volume 16, 2013 - Issue 2
419
Views
12
CrossRef citations to date
0
Altmetric
Original Research Reports

Inappropriately normal plasma ACTH and cortisol concentrations in the face of increased circulating interleukin-6 concentration in exercise in patients with sarcoidosis

, , , , , , , & show all
Pages 202-210 | Received 30 Oct 2011, Accepted 20 Jul 2012, Published online: 24 Aug 2012

Figures & data

Table I.  Anthropometric variables of patients and healthy participants.

Figure 1.  Serum IL-6 (A), plasma ACTH (B), and plasma cortisol (C) concentrations (mean ± SE) at baseline, exercise peak, and recovery (15 min after exercise) in untreated sarcoidosis patients (n = 27), dexamethasone-treated sarcoidosis patients (n = 17), and healthy control participants (n = 20). *Statistically significant (one-factor repeated measures ANOVA, Fisher's post hoc test, p < 0.05) change from the respective within-group baseline concentrations. #,+Statistically significant (one-factor repeated measures ANOVA, Fisher's post hoc test p < 0.05) difference, respectively, from the dexamethasone-treated sarcoidosis patients and the healthy control participants groups, at the same time-point.
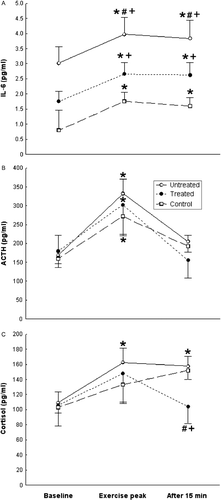
Figure 1.  Serum IL-6 (A), plasma ACTH (B), and plasma cortisol (C) concentrations (mean ± SE) at baseline, exercise peak, and recovery (15 min after exercise) in untreated sarcoidosis patients (n = 27), dexamethasone-treated sarcoidosis patients (n = 17), and healthy control participants (n = 20). *Statistically significant (one-factor repeated measures ANOVA, Fisher's post hoc test, p < 0.05) change from the respective within-group baseline concentrations. #,+Statistically significant (one-factor repeated measures ANOVA, Fisher's post hoc test p < 0.05) difference, respectively, from the dexamethasone-treated sarcoidosis patients and the healthy control participants groups, at the same time-point.

Figure 2.  Serum TNF (A) and serum IL-1β (B) concentrations (mean ± SE) at baseline, exercise peak, and recovery (15 min after exercise) in untreated sarcoidosis patients (n = 27), dexamethasone-treated sarcoidosis patients (n = 17), and healthy controls (n = 20). *Statistically significant (one-factor repeated measures ANOVA, Fisher's post hoc test, p < 0.05) change from the respective within-group baseline concentrations. +Statistically significant (one-factor repeated measures ANOVA, Fisher's post hoc test, p < 0.05) difference from the healthy control participants group, at the same time-point.
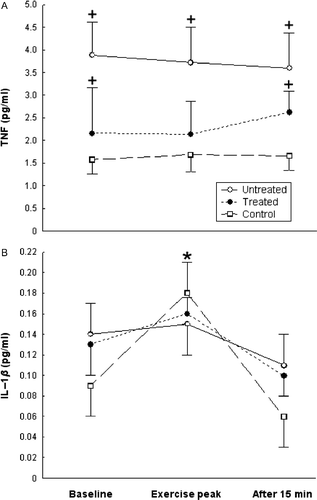
Figure 2.  Serum TNF (A) and serum IL-1β (B) concentrations (mean ± SE) at baseline, exercise peak, and recovery (15 min after exercise) in untreated sarcoidosis patients (n = 27), dexamethasone-treated sarcoidosis patients (n = 17), and healthy controls (n = 20). *Statistically significant (one-factor repeated measures ANOVA, Fisher's post hoc test, p < 0.05) change from the respective within-group baseline concentrations. +Statistically significant (one-factor repeated measures ANOVA, Fisher's post hoc test, p < 0.05) difference from the healthy control participants group, at the same time-point.
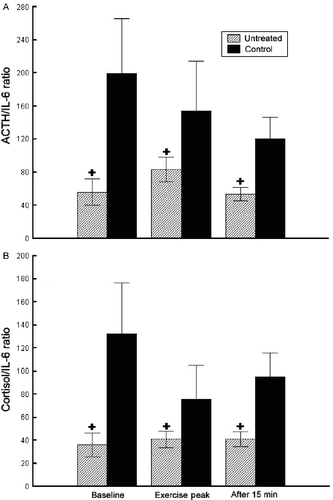
Figure 3.  ACTH to IL-6 ratios (A) and cortisol to IL-6 ratios (B) at baseline, exercise peak, and recovery (15 min after exercise) in untreated sarcoidosis patients (n = 27) and healthy control participants (n = 20). Cortisol to IL-6 ratio should be divided by a 103 factor to correct for the ratio of their respective units (ng/ml for cortisol; pg/ml for IL-6 and ACTH). +Statistically significant (one-factor repeated measures ANOVA, Fisher's post hoc test, p < 0.05) difference from the healthy control participants group, at the same time-point.

Figure 3.  ACTH to IL-6 ratios (A) and cortisol to IL-6 ratios (B) at baseline, exercise peak, and recovery (15 min after exercise) in untreated sarcoidosis patients (n = 27) and healthy control participants (n = 20). Cortisol to IL-6 ratio should be divided by a 103 factor to correct for the ratio of their respective units (ng/ml for cortisol; pg/ml for IL-6 and ACTH). +Statistically significant (one-factor repeated measures ANOVA, Fisher's post hoc test, p < 0.05) difference from the healthy control participants group, at the same time-point.

Reprints and Corporate Permissions

Please note: Selecting permissions does not provide access to the full text of the article, please see our help page How do I view content?

To request a reprint or corporate permissions for this article, please click on the relevant link below:

Academic Permissions

Please note: Selecting permissions does not provide access to the full text of the article, please see our help page How do I view content?

Obtain permissions instantly via Rightslink by clicking on the button below:

If you are unable to obtain permissions via Rightslink, please complete and submit this Permissions form. For more information, please visit our Permissions help page.