Figures & data
Table 1. Primers used in real time RT-PCR.
Figure 1. Effect of the SPS treatment on freezing behavior. Values are means and SEM of the freezing time (% of 10 sec test bin). The significance (**p < 0.01) of the stress treatment compared to the controls based on Fisher’s LSD test is indicated below each time point.
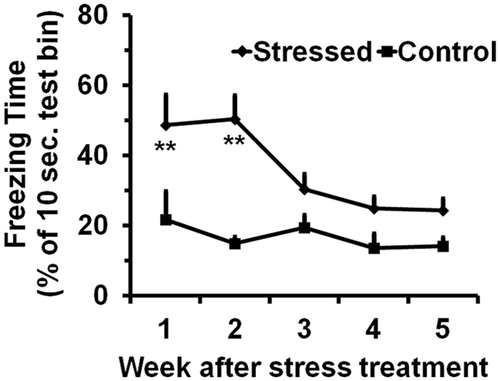
Figure 2. Effect of the SPS treatment on bone mass acquisition in total body as well as specific bones. Values are means and SEM of percentage reductions from the control means, which are shown below the graph. (A) Bone mineral content (BMC). (B) Bone area (B area). (C) Bone mineral density (BMD). The significance (p value, *p < 0.05, or **p < 0.01) of the stress treatment compared to the controls in each bone at each time point based on Fisher’s LSD test is indicated inside the corresponding bar. The significance between two time points is indicated above the corresponding bars.
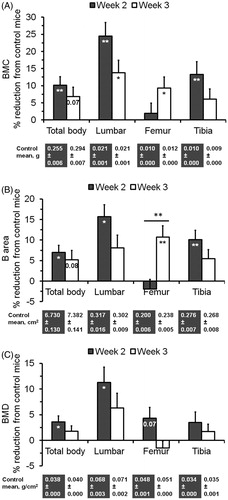
Figure 3. Effect of the SPS treatment and mechanical loading on cortical structure at the mid-diaphysis of the tibia. Values are means and SEM of percentage changes from the control means or the unloaded means, which are below the graph. (A) Effect of the SPS treatment as measured on the unloaded left tibia. (B) Effect of mechanical loading by comparing the loaded right versus unloaded left tibia. The significance (*p < 0.05 or **p < 0.01) of the stressed mice compared to the controls or the loaded right compared to the unloaded left tibia based on t-test is indicated inside the corresponding bar for each parameter. The cross sectional area, total density and material density were calculated or obtained from VOX-TV, Mean1 and Mean2 of the micro-CT data, respectively.
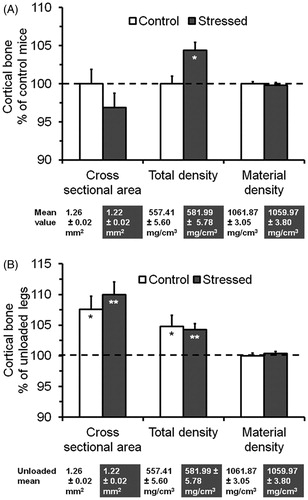
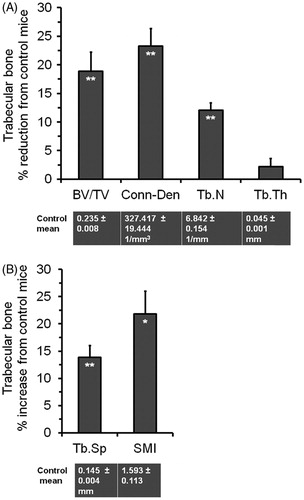
Figure 4. Effect of the SPS treatment on trabecular architecture at the metaphysis of the unloaded left tibia. Values are means and SEM of percentage reductions from the control means, which are shown below the graph. (A) Trabecular parameters with decreasing values. (B) Trabecular parameters with increasing values. The significance (*p < 0.05, or **p < 0.01) of the stress treatment compared to the controls based on t-test is indicated within the corresponding bar for each parameter.