Figures & data
Figure 2. Two daily average body weights in high analgesia (HA) and low analgesia (LA) mice. Body weights of non-stressed (NS) and chronically stressed (CMS) mice from PBS- and B16F0-inoculated groups were measured to monitor the overall health status. Statistically significant differences in body weight were observed between the NS and CMS groups from the HA line across time. Post-hoc comparisons within each line. *: B16F0-inoculated group versus PBS-inoculated group from NS conditions; #: B16F0-inoculated group versus PBS-inoculated group from CMS conditions; x: B16F0-inoculated group from CMS conditions versus B16F0-inoculated group from NS conditions. Symbols indicate p < 0.05. In the HA line, each B16F0-inoculated group consisted of 20 mice. In the LA line, the B16F0-inoculated group from NS conditions consisted of 6 mice with tumors and 14 mice without tumors. In the same line, B16F0-inoculated groups from CMS conditions consisted of 10 mice with developed tumors and 10 mice without tumors. Each PBS-inoculated group from the HA line and the LA line consisted of 10 mice.
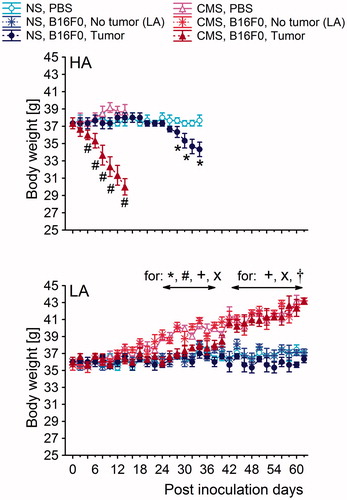
Figure 1. Experimental protocol. High analgesia (HA) mice from the non-stressing (NS) group and the chronic mild stress (CMS) group were monitored for 14 and 34 post-inoculation days, respectively. Low analgesia (LA) mice from both the NS group and the CMS group were well maintained and monitored for 62 post-inoculation days (PID).
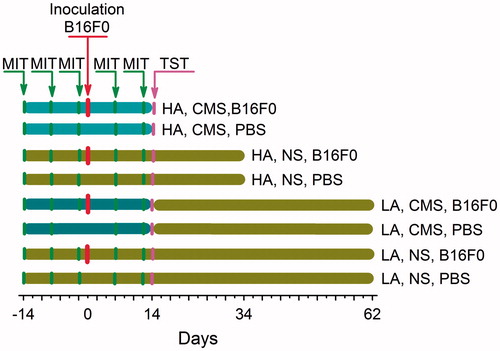
Figure 3. Milk intake test (MIT) in the high analgesia (HA) and low analgesia (LA) mice performed at baseline, 7 days, 14 days, 21 days, and 28 days after the start of chronic mild stress (CMS). The intake of milk in the CMS-B16F0 and CMS-PBS groups (as controls for the melanoma group) was significantly lower than in the NS-Melanoma and NS-PBS groups at 7, 14, 21 and 28 days after the start of CMS in the HA line and at 21 and 28 in the LA line. Post-hoc comparisons within in each line: +: (PBS-inoculated group from CMS conditions versus PBS-inoculated group from NS conditions); x: (B16F0-inoculated group from CMS conditions versus B16F0-inoculated group from NS conditions). Symbols indicate p < 0.05. In the HA line, each B16F0-inoculated group consisted of 20 mice. In the LA line, the B16F0-inoculated group from NS conditions consisted of 6 mice with tumors and 14 mice without tumors. In the same line, B16F0-inoculated groups from CMS conditions consisted of 10 mice with developed tumors and 10 mice without tumors. Each PBS-inoculated group from the HA line and the LA line consisted of 10 mice.
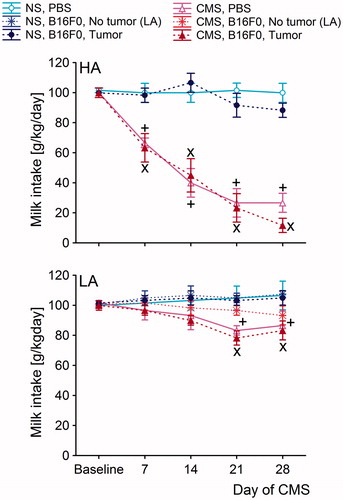
Figure 4. Mean time of immobility (±SE) in the tail suspension test (TST) in high analgesia (HA) and low analgesia (LA) mice. Mice were housed in non-stress conditions (NS) or in chronic mild stress conditions (CMS) and were inoculated with PBS (PBS groups) or B16F0 melanoma cells (B16F0 groups). Post-hoc comparisons within each line: +: (PBS-inoculated group from CMS conditions versus PBS-inoculated group from NS conditions); x: (B16F0-inoculated group from CMS conditions versus B16F0-inoculated group from NS conditions); @: (CMS x Tumor growth). Interaction between CMS interactions between lines: &: Line x CMS (for PBS- and B16F0-inoculated groups). n.s.: p = 0.062. Symbols indicate p < 0.05. In the HA line, each B16F0-inoculated group consisted of 20 mice. In the LA line, the B16F0-inoculated group from NS conditions consisted of 6 mice with tumors and 14 mice without tumors. In the same line, the B16F0-inoculated groups from CMS conditions consisted of 10 mice with developed tumors and 10 mice without tumors. Each PBS-inoculated group from the HA line and the LA line consisted of 10 mice.
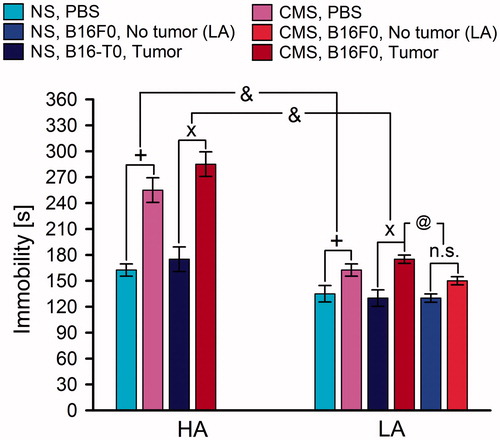
Figure 5. The time course of the change in plantar width of the plantar-inoculated mice of the high analgesia (HA) and low analgesia (LA) lines. Mice were given a subcutaneous injection of B16F0 cells into the plantar region of left hind paw. The values are the mean ± S.E.M. Post-hoc comparisons within each line: *: (B16F0-inoculated group versus PBS-inoculated group from NS conditions); #: (B16F0-inoculated group versus PBS-inoculated group from CMS conditions). Symbols indicate p < 0.05. In the HA line, each B16F0-inoculated group consisted of 20 mice. In the LA line, the B16F0-inoculated group from NS conditions consisted of 6 mice with tumors and 14 mice without tumors. In the same line, B16F0-inoculated groups from CMS conditions consisted of 10 mice with developed tumors and 10 mice without tumors. Each PBS-inoculated group from the HA line and the LA line consisted of 10 mice.
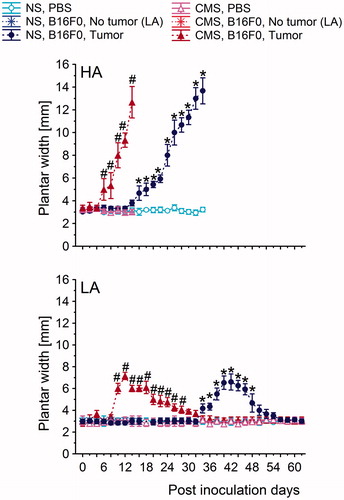
Figure 6. Melanoma tumor processes in the high analgesic (HA) and low analgesic (LA) mice after subcutaneous inoculation with B16F0 melanoma cells into the plantar region of the hindpaw.
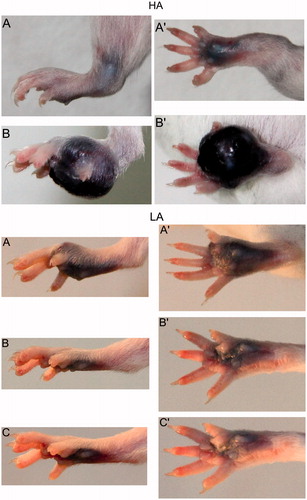
Table 1. Summary of the results. ↑ – increase or ↔ – no changes in tumor growth, cancer pain or depression-like behavior in comparison to the Control or Melanoma groups.
Figure 7. Baseline nociceptive latencies (±SE) in high analgesia (HA) and low analgesia (LA) mouse lines. Nociception was measured with using a heat analgesiometer. Each line consisted of 40 mice. # indicate p < 0.05 (HA line versus LA line).
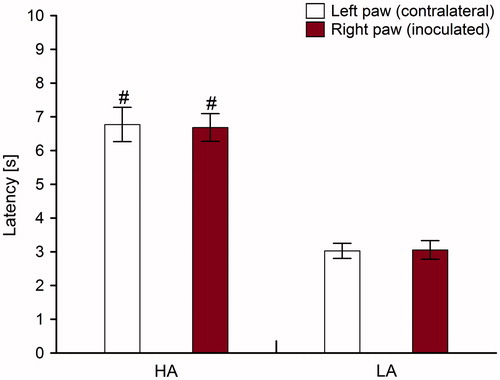
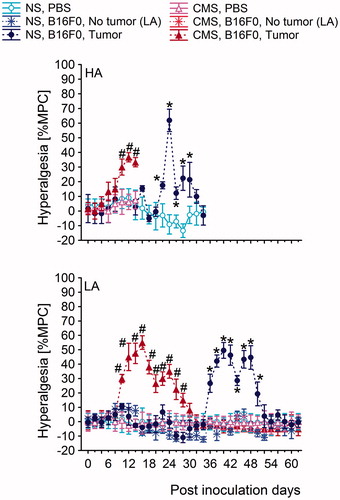
Figure 8. Time course of the development of thermal hyperalgesia in high analgesia (HA) and low analgesia (LA) mice. The pain threshold was measured in the ipsilateral paw and the contralateral paw stimulated with radiant heat. The values are the mean ± S.E.M. Post-hoc comparisons within each line: *: (B16F0-inoculated group versus PBS-inoculated group from NS conditions); #: (B16F0-inoculated group versus PBS-inoculated group from CMS conditions). Symbols indicate p < 0.05. In the HA line, each B16F0-inoculated group consisted of 20 mice. In the LA line, the B16F0-inoculated group from NS conditions consisted of 6 mice with tumors and 14 mice without tumors. In the same line, B16F0-inoculated groups from CMS conditions consisted of 10 mice with developed tumors and 10 mice without tumors. Each PBS-inoculated group from the HA line and the LA line consisted of 10 mice. %MPC: (maximum possible change).