Figures & data
Table 1. Participant characteristics for demographics, exercise, health, adverse life events and lifetime incidence of psychological disorders.
Table 2. Correlations between exercise, BMI, adverse life events and health problems.
Table 3. Moderation of the MLE-health problems (complaints) relationship by exercise and gendera.
Table 4. Moderation of the CALE-health problems (complaints) relationship by exercise and gendera.
Figure 1. Moderation by moderate or vigorous exercise (MV exercise) of the MLE and self-reported health relationships for (a) total, (b) cardiovascular and (c) psychological problems as measured by the Cornell Medical Index. Higher levels of stress (MLE score) were associated with poorer health for both total and psychological problems in both adjusted and non-adjusted models (p < 0.001). Stress was associated with cardiovascular health in non-adjusted models (p = 0.037) but there was no association in adjusted models (p = 0.083). Interactions between exercise and stress emerged such that at increasing levels of exercise this linear effect became more marked (p values = 0.017, 0.013 and 0.037, respectively). Associations were tested by hierarchical multiple linear regression (n = 395). Stress is shown at 1 SD below and above the mean MLE score. MV exercise is shown at the mean (114 min) and 1 SD below and above the mean (31 and 197 min). For cardiovascular complaints, stress was not associated with exercise at 31 and 114 min (p > 0.05). Values for health outcomes are log transformed.
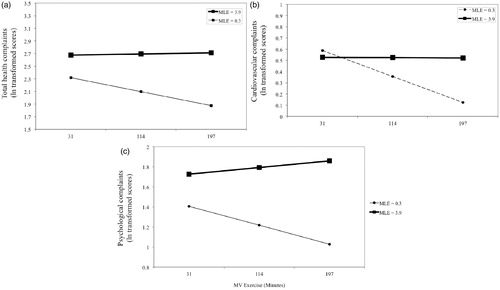
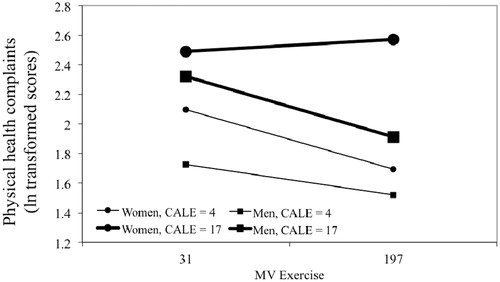
Figure 2. Moderation by moderate or vigorous exercise (MV exercise) of relationships between CALE score with self-reported physical health as measured by the Cornell Medical Index. The three-way interaction between stress, exercise and sex was significant in both non-adjusted and adjusted models (p values = 0.029 and 0.026, respectively). Associations were tested by hierarchical multiple linear regression (n = 381). All slopes were significantly different from 0 (p < 0.05), except the slope for women at high stress (simple slopes tests). This same slope was different from all other slopes, which did not differ from each other (slopes differences tests). Stress (CALE score) is shown at 1 SD below and above the mean as is MV exercise (31 and 197 min). Values for health problems are log transformed.