Figures & data
Figure 1. Early life and adult stress with/without amitriptyline on GR and MR in hippocampal sub-fields. LEFT. Mean number per unit area (0.1 mm2) of (A) glucocorticoid receptor-immunoreactive (GR-IR) neurons in the CA3 subfield and (B) mineralocorticoid receptor-immunoreactive (MR-IR) neurons in CA2 of non-maternally separated (NMS) and maternally separated (MS) rats submitted to chronic variable stress (CVS) or not (NCVS) under amitriptyline (10 mg/kg; AMI) or vehicle (Vehic) treatment. Data were analyzed by a linear mixed effect model followed by LSD post hoc test. Data are mean + SEM. Number of rats per group is included inside each bar. Significant differences: a, indicates p < 0.05 versus respective Vehic group; b, indicates p < 0.05 versus respective NCVS; c, indicates p < 0.05 versus respective NMS. RIGHT. Representative photomicrographs. (C) GR-IR neurons in the CA3 subfield of the hippocampus of the MS (left two columns) and CVS rats under AMI or Vehic treatment. Note that MS rats exposed to CVS showed increased GR expression. Statistically significant difference shown in graph A is indicated (b). (D) MR-IR neurons in the CA2 subfield of the hippocampus of NMS (columns 1 and 3) and MS rats, NCVS (columns 1 and 2) and CVS under AMI treatment. Statistically significant differences shown in graph B are indicated (a,b,c).
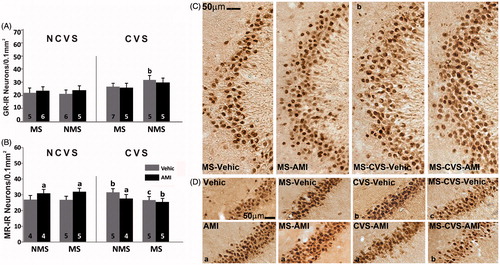
Figure 2. Early life and adult stress with/without amitriptyline on GR and MR in amygdala LEFT. Mean number per unit area (0.1 mm2) of (A) glucocorticoid receptor-immunoreactive (GR-IR) neurons in the medial amygdaloid nucleus; (B,C) mineralocorticoid receptor-immunoreactive (MR-IR) neurons in (B) the central, and (C) medial amygdaloid nuclei of non-maternally separated (NMS) and maternally separated (MS) rats submitted to chronic variable stress (CVS) or not (NCVS) under amitriptyline (10 mg/kg; AMI) or vehicle (Vehic) treatment. Data were analyzed by a linear mixed effect model followed by LSD post hoc test. Data are mean + SEM. Number of rats per group is included inside each bar. Significant differences: a, p < 0.05 versus respective Vehic; b, p < 0.05 versus respective unstressed; c, p < 0.05 versus respective NMS. RIGHT. Representative photomicrographs. (D) GR-IR neurons in the medial amygdaloid nucleus of the NMS and MS NCVS (Rows 1 and 2) and CVS rats under AMI or Vehic treatment. Significant differences shown in graph A are indicated (a,b). (E) MR-IR neurons in the central amygdaloid nucleus of NMS (left 2 columns), MS, NCVS (upper 2 rows) and CVS rats under AMI or Vehic treatment. Significant differences shown in graph B are indicated (a,b,c).
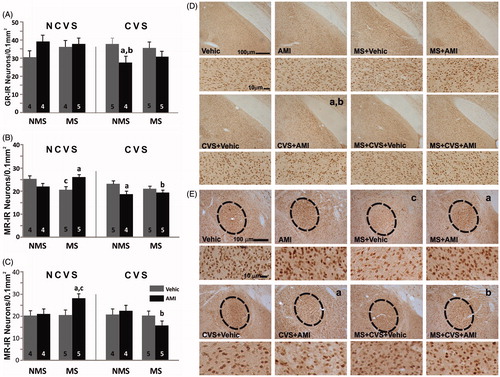
Figure 3. Early life and adult stress with/without amitriptyline on GR and MR in septum. UPPER ROW. Mean number per area unit (0.1 mm2) of (A) glucocorticoid receptor-immunoreactive (GR-IR) neurons in the lateral septum, and (B) mineralocorticoid receptor-immunoreactive (MR-IR) neurons in the septohippocampal nucleus of non-maternally separated (NMS) and maternally separated (MS) rats submitted to chronic variable stress (CVS) or not (NCVS) under amitriptyline (10 mg/kg; AMI) or vehicle (Vehic) treatment. Data were analyzed by a linear mixed effect model followed by LSD post hoc test. Data are mean + SEM. Number of rats per group is included inside each bar. Significant differences: b, p < 0.05 versus respective NCVS group; c, p < 0.05 versus respective NMS group. LOWER ROWS. Representative photomicrographs. (C) GR-IR neurons in the lateral septum of NMS (left 2 columns), MS (right two columns), NCVS (upper 2 rows) and CVS (lower two rows) rats under AMI or Vehic treatment. The statistical differences shown in graph A are indicated (a,b,c). (D) MR-IR neurons in the septohippocampal nucleus of NMS (left 2 columns), MS (right two columns), NCVS (upper row) and CVS (lower row) rats under AMI or Vehic treatment. Significant differences shown in graph B are indicated (b,c).

Figure 4. Ratio of density of mineralocorticoid: glucocorticoid receptor-immunoreactive neurons (MR:GR). Data are for dentate gyrus of non-maternally separated (NMS) and maternally separated (MS) rats submitted to chronic variable stress (CVS) or not (NCVS) under amitriptyline (10 mg/kg; AMI) or vehicle (Vehic) treatment. Data are mean + SEM. Number of rats per group is included inside each bar. Significant difference (ANOVA followed by the LSD post hoc test): c, p < 0.05 versus respective NMS group.
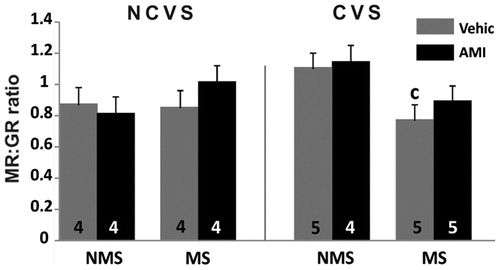
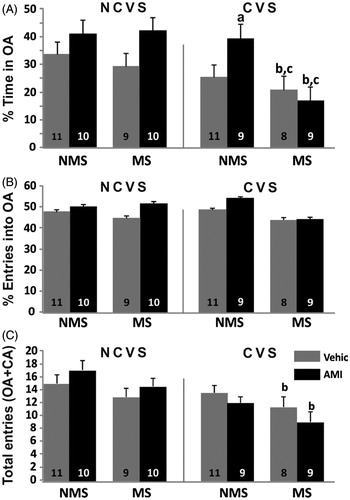
Figure 5. Plus Maze Test. Data are behaviors during a 5-min exposure of non-maternally separated (NMS) and maternally separated (MS) rats submitted to chronic variable stress (CVS) or not (NCVS) under amitriptyline (10 mg/kg; AMI) or vehicle (Vehic) treatment. Data are mean + SEM. Number of rats per group is included inside each bar. (A) %Time spent in the open arms (OA); (B) % Number of entries into the OA; (C) Number of total entries (open+closed arms). Significant differences (ANOVA followed by the LSD post hoc test): a, p < 0.05 versus respective Vehic; b, p < 0.05 versus respective NCVS; c, p < 0.05 versus respective NMS.