Figures & data
Figure 1. Maternal separation influence on hypothalamic cell density of male offspring on postnatal day (PND) 21 and PND 36. Histograms showing (A) nuclear counts (methylene blue staining on PND 21) and (B) neuronal specific nuclear protein(NeuN) immunostaining on PND 36 in the respective hypothalamic nuclei. Data represent mean ± SEM. n = 3. *p < 0.05, **p < 0.01. (Student t-test). MS: maternal separation; AFR: animal facility reared control. MPOc: medial preoptic nucleus compact division; MPOm: medial preoptic nucleus medial division; PePO: periventricular preoptic nucleus; PVNmpd: paraventricular nucleus medial parvocellular division; SChdl: suprachiasmatic nucleus dorsolateral division; AHA: anterior hypothalamic area; Arc: arcuate hypothalamic nucleus; VMH: ventromedial hypothalamic nucleus. Panels C–G′: representative photomicrographs (AFR: left column; MS: right column) showing C and C′ NeuN immunostaining of coronal preoptic/anterior hypothalamus around Bregma −0.96 mm with higher magnification of dashed rectangles showed in D and D′. (E and E′) Coronal sections around tuberal hypothalamus, Bregma −2.28 mm. Note the difference of cell density and the span of the nuclear regions on PND 36. Glial fibrillary acidic protein (GFAP) staining for astrocytes shows uneven immunostaining patterns (F and F′). However, some regions showed increased astrocytic densities in the MS sections, e.g. regions marked by dashed ovals corresponding to supraoptic and suprachiasmatic nuclei and periventricular regions (dashed rectangles showed in higher magnification in panels G and G′). In contrast to hypothalamus, the hippocampus on PND 36 exhibits an ordered GFAP+ astrocyte distribution (panel H). Scale bars: 500 μm for panels C, C′, E, E′, F, F′ and H; 50 μm for other panels.
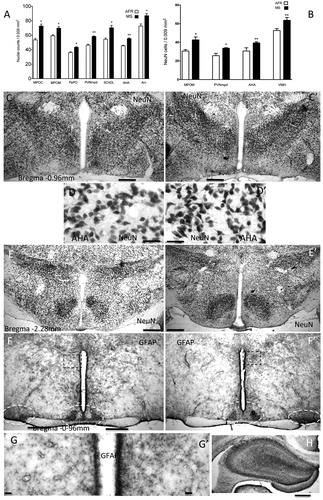
Figure 2. Effect of MS on the expression of pro-apoptotic active (cleaved) caspase 3 protein in early postnatal and young adult rat hypothalamus. Time course of expression of active caspase 3 (cleaved caspase 3) levels in animal facility reared (AFR) and maternally separated (MS) rats. PND: postnatal day. (a) Representative Western blots illustrating immunoreactivity for active caspase 3 and β-actin from dissected hypothalamus. (b) Densitometric analysis of active caspase 3 immunoblots. Each age point (PND) indicates the ratio of the active protein to the total protein expressed as the relative level of expression, estimated as a percentage of PND 1 values. Data are mean ± SEM. Open circles correspond to AFR and black boxes to MS rats. Statistical analyses by factorial ANOVA was used to determine the effects of MS treatment, age and treatment × age on protein levels (). *p < 0.05 versus AFR group (n = 6 rats per group per day).
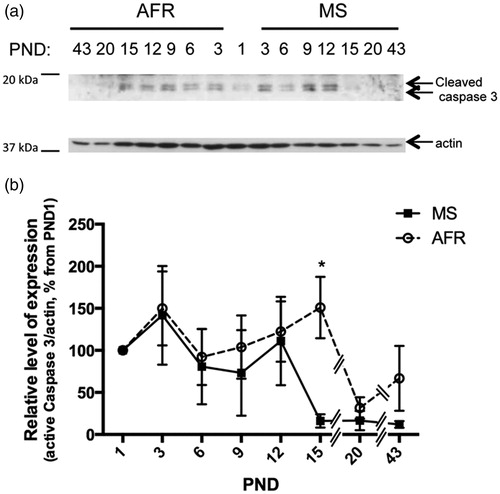
Table 1. Summary of statistical analysis of relative protein expression from MS and AFR.
Figure 3. Effect of MS on the ratio of expression of anti-apoptotic Bcl-2 and pro-apoptotic Bax proteins in early postnatal and young adult rat hypothalamus. Time course of expression of the ratio between Bcl2 and Bax in animal facility reared (AFR) and maternally separated (MS) rats. PND: postnatal day. (a) Representative Western blots illustrating immunoreactivity for Bcl-2, Bax and β-actin proteins from dissected hypothalamus. (b) Densitometric analysis of Bcl-2 and Bax immunoblots. Each age point indicates the ratio of the relative level of expression of Bcl-2 and Bax. Data are mean ± SEM. Open circles correspond to AFR and black boxes to MS rats. Statistical analyses by factorial ANOVA was used to determine the effects of MS treatment, age and treatment × age on protein levels (): *p < 0.05 and ***p < 0.001 versus AFR group (n = 6 rats per group per day).
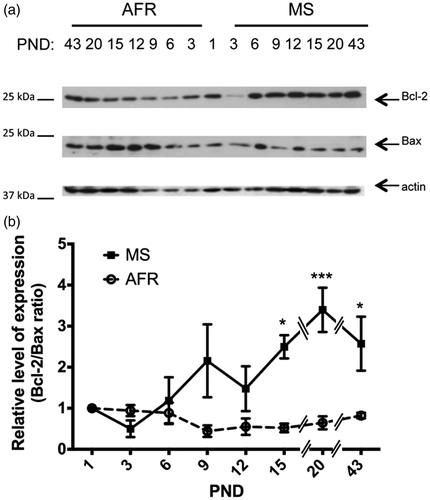
Figure 4. Effect of MS on the expression of survival active (phosphorylated) ERK1/2 kinase in early postnatal and young adult rat hypothalamus. Time course of expression of activated ERK1/2 (phosphorylated ERK1/2, pERK) levels in animal facility reared (AFR) and maternally separated (MS) rats. PND: postnatal day. (a) Representative Western blots illustrating immunoreactivity for pERK1/2 and total ERK1/2 from dissected hypothalamus. (b) Densitometric analysis of pERK1/2 immunoblots. Each age point indicates the ratio of the active protein to the total protein expressed as the relative level of expression, estimated as a percentage from PND 1. Data are mean ± SEM. Open circles correspond to AFR and black boxes to MS rats. Statistical analyses by factorial ANOVA was used to determine the effects of MS treatment, age and treatment × age on protein levels (): *p < 0.05 and **p < 0.01 versus AFR group (n = 6 rats per group per day).
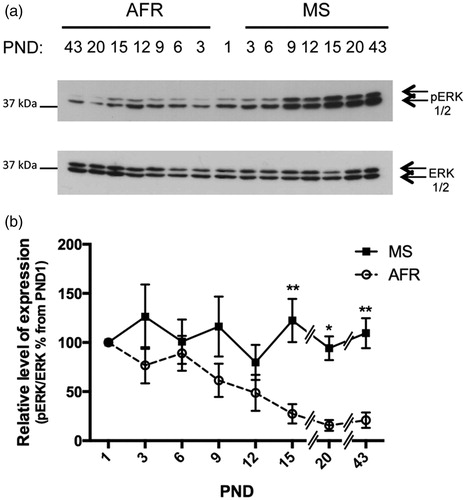
Figure 5. Effect of MS on the expression of survival active (phosphorylated) Akt kinase in early postnatal and young adult rat hypothalamus. Time course of expression of activated Akt (phosphorylated Akt, pAkt) levels in animal facility reared (AFR) and maternally separated (MS) rats. PND: postnatal day. (a) Representative Western blots illustrating immunoreactivity for pAkt and β-actin (same membrane as for caspase 3) from dissected hypothalamus. (b) Densitometric analysis of pAkt immunoblots. Each age point indicates the ratio of the active protein to the total protein expressed as the relative level of expression, estimated as a percentage from PND 1. Data are mean ± SEM. Open circles correspond to AFR and black boxes to MS rats. Statistical analyses by factorial ANOVA was used to determine the effects of MS treatment, age and treatment × age on protein levels (): **p < 0.01 and ****p < 0.0001 versus AFR group (n = 6 per group per day).
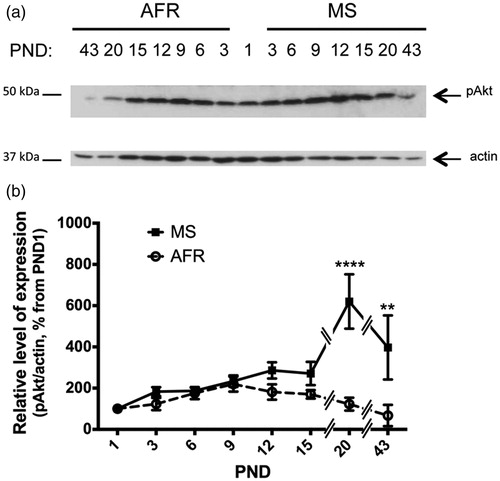
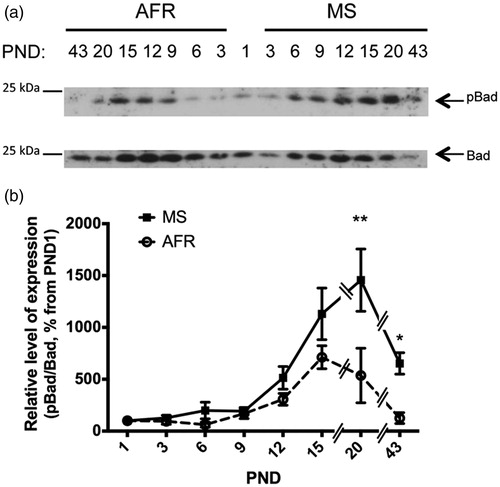
Figure 6. Effect of MS on the expression of anti-apoptotic inactive (phosphorylated) Bad kinase in early postnatal and young adult rat hypothalamus. Time course of expression of inactivated Bad (phosphorylated Bad at Ser112, pBad) levels in animal facility reared (AFR) and maternally separated (MS) rats. PND: postnatal day. (a) Representative Western blots illustrating immunoreactivity for pBad and Bad from dissected hypothalamus. (b) Densitometric analysis of pBad immunoblots. Each age point indicates the ratio of the inactive protein to the total protein expressed as the relative level of expression, estimated as a percentage from PND 1. Data are mean ± SEM. Open circles correspond to AFR and black boxes to MS rats. Statistical analyses by factorial ANOVA was used to determine the effects of MS treatment, age and treatment × age on protein levels (): *p < 0.05 and **p < 0.01 versus AFR group (n = 6 rats per group per day).